Bitcoin (BTC/USD) Continues To Pummel $60k - Will More Buyers Pile In?
Bitcoin hasn’t really been doing much of its common spectacular performance in recent weeks as the cryptocurrency has been struggling to push beyond the 60,000 dollar mark. The overall sentiment is still strongly bullish for BTC/USD but it has been confined to a tight range between 55,000 and 60,000 since the end of March after it faced a strong sell-off.
The thing with Bitcoin is that it is not a speculative bubble by definition, given how bubbles get to an unsustainable level and then they burst without the possibility of reinflating, something that Bitcoin has done on many occasions. And although there is definitively a speculative nature behind them, cryptocurrencies seem to have some sort of store of value, which is not intrinsic in nature and falls solely in the eye of the beholder, which makes it the more volatile.

Image Source: Pexels
If we look at the technical angle, the picture is pretty bullish, especially after a lack of strong momentum has reset overbought conditions and has allowed new buyers to enter the market. The issue with overcoming the $60,000 area is that it is a strong psychological level, and many investors are likely wondering whether Bitcoin’s price has gone too far.
If we look at its performance in the last 4 months, BTC/USD has risen by more than 38,000 dollars, which is equivalent to around 200%. Take the previous 4 months and it “only” managed to rise about 65% or 7,800 dollars. If we decide to look at the cryptocurrency’s previous buying frenzy back in 2018, price rose 15,000 dollars in 4 months, which was equivalent to 350% at that time. So yes, Bitcoin is known for sudden outbursts of over-valuation, but you can’t really compare a 300% move when price was at $4,000 with a 200% move when price was at $20,000. At some point, the recent rally has to become over-exhausted and new buyers won’t be attracted as they deem the price too expensive.
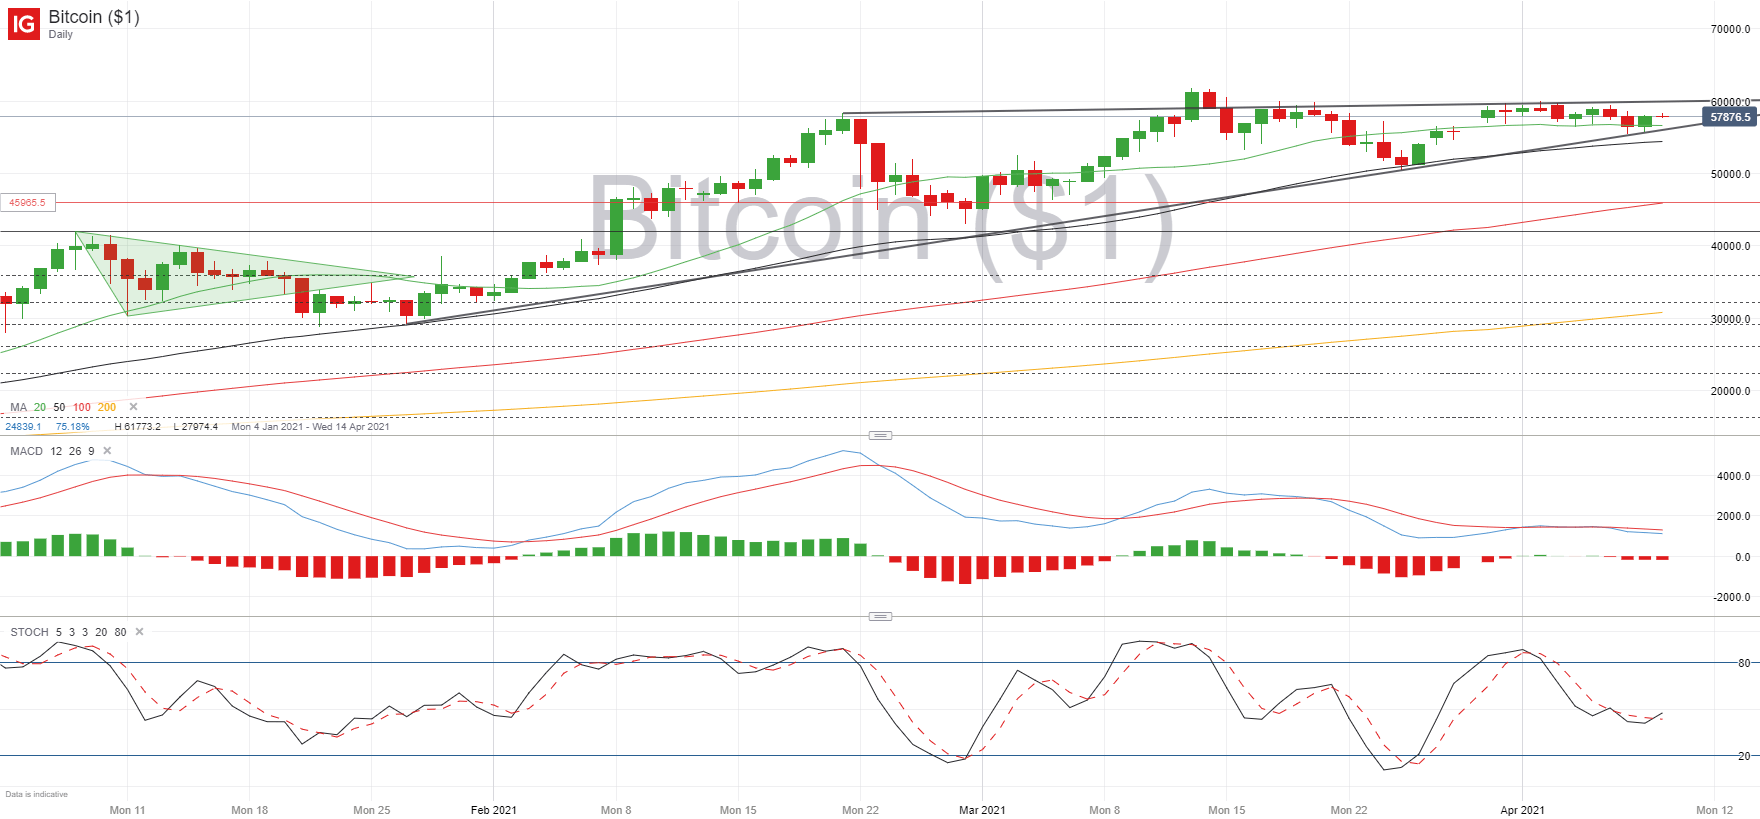
The main question is, is this that time? The daily chart suggests not. The formation of an ascending triangle is hinting at further upside potential, and given how the pattern is near culmination, the move higher could come as soon as next week. If so, look for strong psychological levels with Bitcoin, so $65,000 could easily be the next target, although buyers will need to push above resistance at the all-time high level of $61,773.
If BTC/USD fails to break above the triangle there will likely be a good opportunity to bring on a good retracement towards more manageable levels at which point new buyers will likely bring the price back up again. $55,960 is the immediate support level followed by the $55,000 mark. A good level to consider coming into the market as a new buyer would be anywhere between $45,900 and $41,900.
BTC/USD Daily chart
(Click on image to enlarge)