Tuesday, January 21, 2020 2:12 PM EDT
Bitcoin is 20% higher in the month of January as it looks to recreate the stellar performance it enjoyed in 2019. That being said, Bitcoin’s return in the second half of last year was less encouraging and it left the cryptocurrency grasping for support. Now, BTC/USD has rebounded to probe the 200-day simple moving average around $9,000. Will BTC continue higher or will the technical barrier mark the end of the rally?
BITCOIN (BTC) PRICE CHART: DAILY TIME FRAME (APRIL 2019 – JANUARY 2020) (CHART 1)
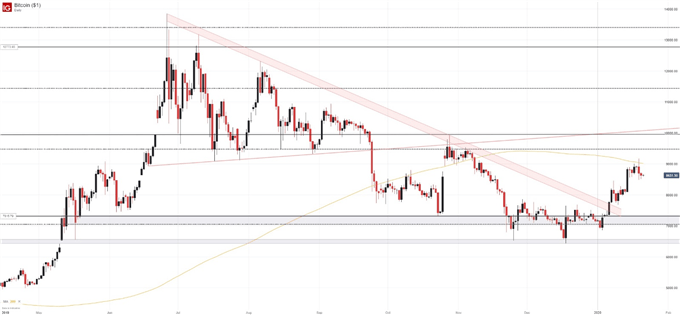
Bitcoin suffered a brief flash crash over the weekend, highlighting the uncertainty and volatility that can accompany bitcoin trading. Nevertheless, price remains within reach of the 200-day moving average around the $9,000 mark and bulls will look to press higher still. The technical level will offer robust resistance – as it has in the past – but a break above could open the door for further gains.
Should the level fail, secondary resistance will materialize around the $9,500 area where a Fibonacci level resides and at the psychologically significant $10,000 level. Together, the levels will look to keep BTC/USD contained. While bulls have undoubtedly shown interest, IG Client Sentiment reveals most retail traders are net-long which we typically view as a contrarian indicator.
To that end, should bears look to resume the downtrend that began in June, BTC will look to employ support at the $7,350 to $7,000 level before secondary support can provide buoyancy around $6,500.
Disclaimer: DailyFX, the free news and research website from IG, is one of the world's leading sources for news and analysis ...
more
Disclaimer: DailyFX, the free news and research website from IG, is one of the world's leading sources for news and analysis on the currency, commodity and index trading community. With nine internationally-based analysts publishing over 30 articles and producing 5 video news updates daily, DailyFX offers in-depth coverage of price action, predictions of likely market moves, and exhaustive interpretations of salient economic and political developments. DailyFX is also home to one of the most powerful economic calendars available on the web, complete with advanced sorting capabilities, detailed descriptions of upcoming events on the economic docket, and projections of how economic report data will impact the markets. Combined with the free charts and live rate updates featured on DailyFX, the DailyFX economic calendar is an invaluable resource for traders who heavily rely on the news for their trading strategies. Additionally, DailyFX serves as a portal to one of the most vibrant online discussion forums in the forex trading community. Avoiding market noise and the irrelevant personal commentary that plague many forex blogs and forums, the DailyFX Forum has established a reputation as being a place where real traders go to talk about serious trading.
Any opinions, news, research, analyses, prices, or other information contained on dailyfx.com are provided as general market commentary and does not constitute investment advice. Dailyfx will not accept liability for any loss or damage, including without limitation to, any loss of profit, which may arise directly or indirectly from use of or reliance on such information.
less
How did you like this article? Let us know so we can better customize your reading experience.


