
Bitcoin Braces For High Volatility As Prominent Analysts Eye Two Crucial Price Levels
Bitcoin hit a new all-time high on December 1 but then drifted to $17,580 amid profit-taking and a technical correction from the overbought territory by December 11. Market experts warned that BTC might have been poised for a deeper sell-off before the growth resumed; however, despite the numerous bearish signals, the collapse has not materialized so far.

Image Source: Pixabay
At the time of writing, BTC is changing hands at $19,140. The coin recovered above $19,000 amid increased buying pressure during the weekend and tested the local resistance area of $19,600. Josh Olszewicz also notes the importance of this barrier.
— Josh Olszewicz (@CarpeNoctom) December 14, 2020
Volatility is back
Behavioural analytics provider Santiment recorded a massive spike in Bitcoin's Age consumed, suggesting that volatility is about to strike back. The metric shows how many tokens changed addresses on a given date, multiplied by the time since they last moved.
The spikes on the chart mean that a lot of previously idle tokens have come into motion. While the metric says nothing about the direction of the price movement, it is regarded as an early signal that large players are up to something. The increase in Age Consumed is often followed by a spike of volatility.
(Click on image to enlarge)
%20[14.07.30,%2014%20Dec,%202020]-637435415774952486.png)
BTC's Age Consumed chart
Meanwhile, from the technical point of view, BTC sits on top of strong support around $19,000. IntoTheBlock's "In/Out of the Money Around Price" shows that over 1.3 million addresses previously purchased over 900,000 BTC between the current price and $18,500. This wall may absorb the selling pressure and trigger a massive recovery towards the local resistance at $19,600, followed by the all-time high of $19,915 and, eventually, $20,000.
(Click on image to enlarge)
%2014-637435416085595772.png)
BTC's In/Out of the Money Around Price data
Tradermayne, a prominent crypto Twitter analyst, notes that a rebound from the support area will result in a jump towards $22,000.
#Bitcoin
— Mayne of Tether (@Tradermayne) December 14, 2020
Set up from today's stream.
This would go along with a gap fill narrative, nice H12 breaker set up.
If given I will take it. Below that H12 level things could get ugly so RR is nice.
Target $22k which is the 1.618 fib extension of the main impulse price swing. pic.twitter.com/cgOAOyX0TK
Meanwhile, a sustainable move below $18,500 will create a strong downside momentum and cause BTC sell-off towards the recent low of $17,500, followed by $16,500 with little to no barriers on the way down.
(Click on image to enlarge)
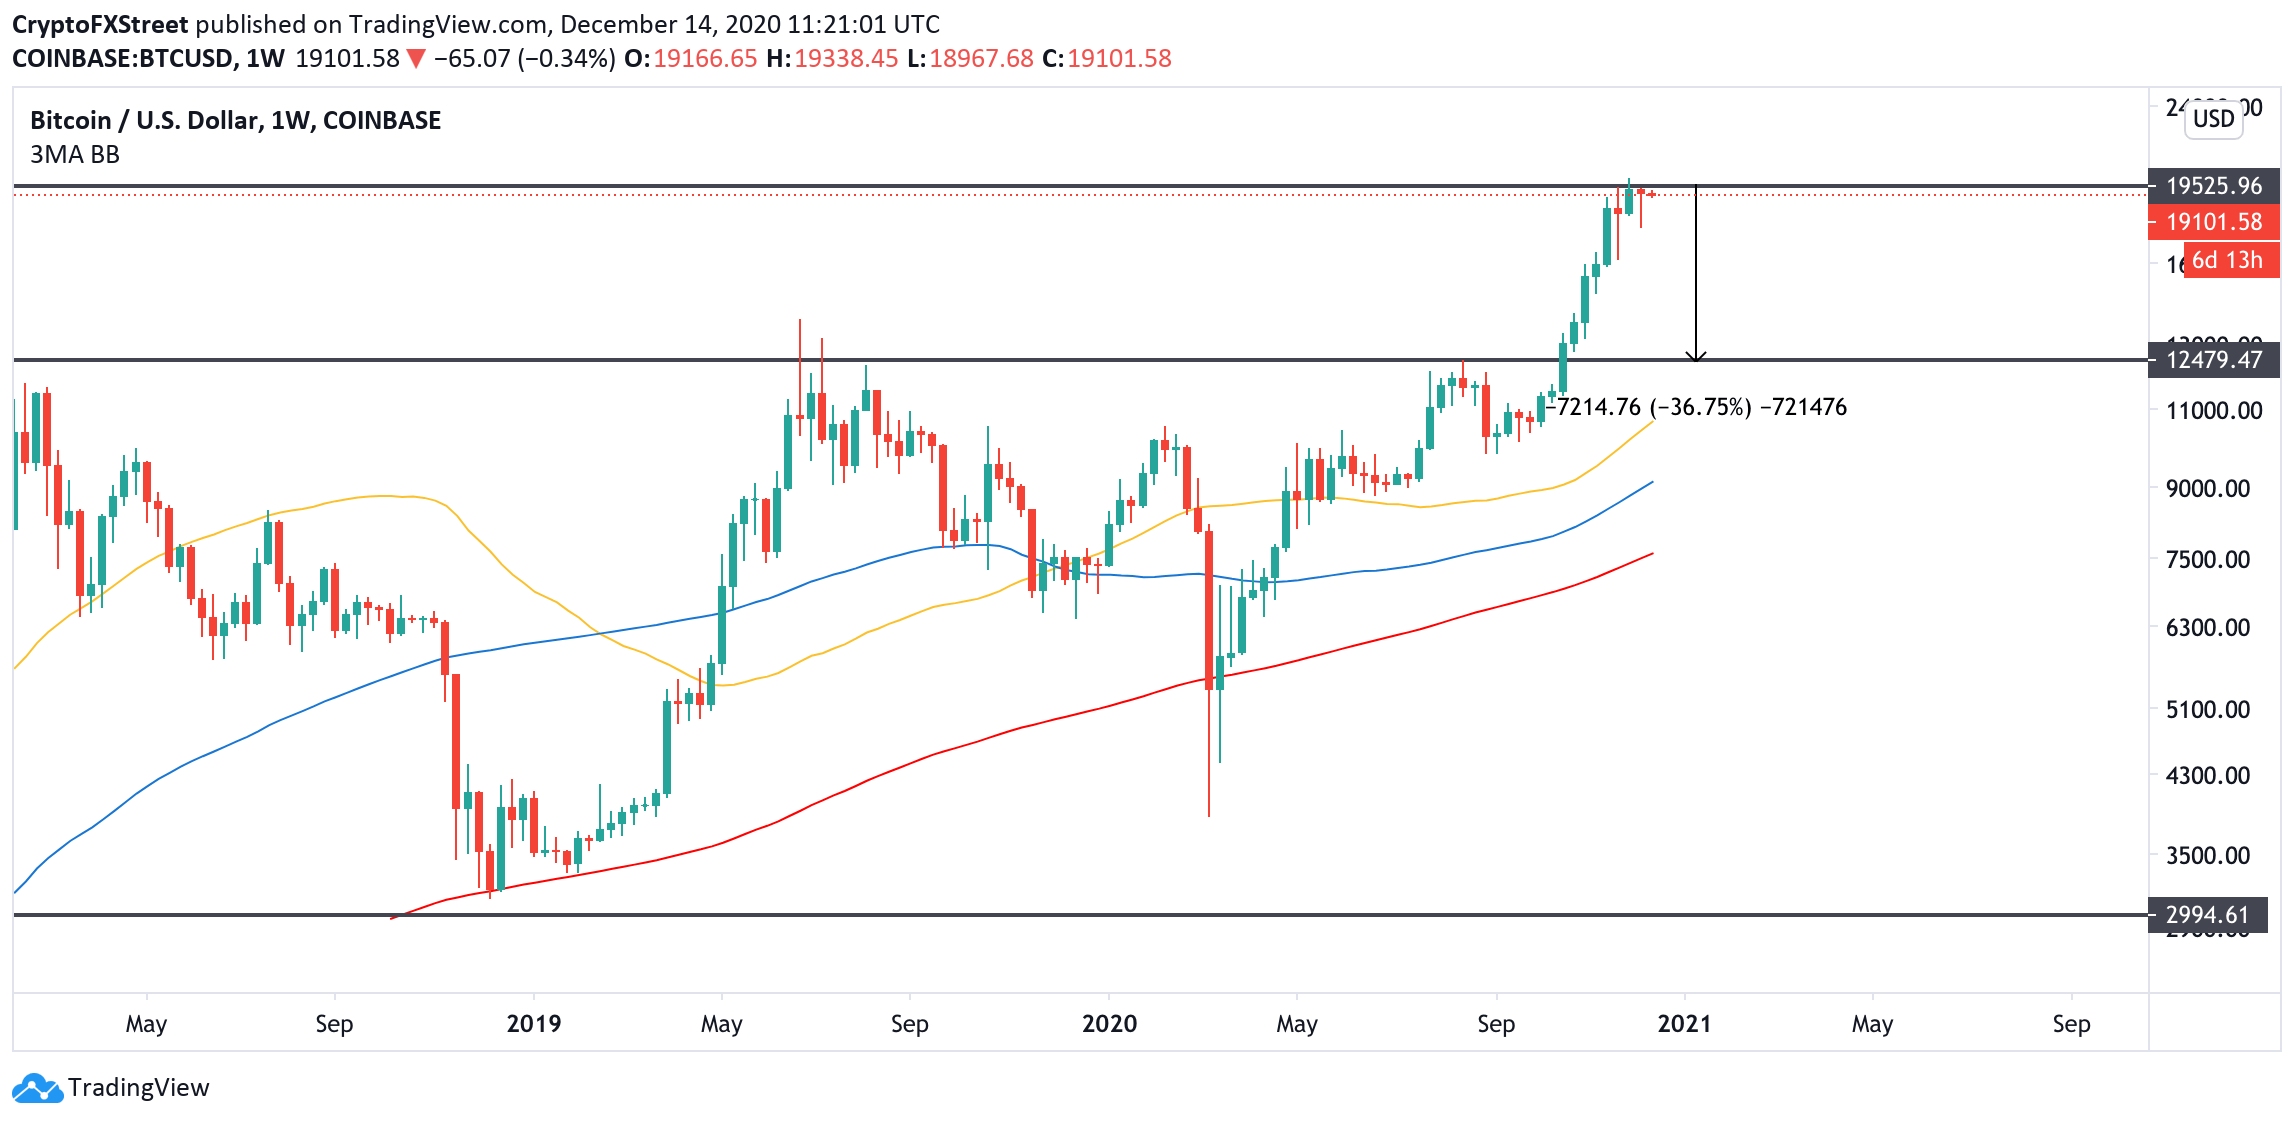
BTC weekly chart
On the other hand, the long-term timeframes imply that Bitcoin can safely retreat to $13,000 or $12,500 within the downside correction. This move would represent a 35% correction from the current level, rebalance the overbought market and allow for a price increase towards a new all-time high. The overall trend is bullish as long as the price stays above this area.
Disclosure: Information on this article contains forward-looking statements that involve risks and uncertainties. Markets and instruments profiled on this page are for informational ...
more

