
Bitcoin – Take Advantage Of Any Dip Below 10K
Bitcoin and Ethereum had both advanced quite significantly since our last in depth Bitcoin analysis. Not only did Bitcoin breakout to the upside, it already went up to US$12,500 and is now experiencing a recovery after a first and brief dip back below US$10,000. Should be see another pullback of Bitcoin – Take Advantage Of Any Dip Below 10K!
Review
After the price of Bitcoin had been consolidating sideways primarily between US$9,000 and US$10,000 for over 11 weeks, the expected and timely announced breakout from the consolidation triangle finally occurred on July 21st. As always, everything happened quite quickly during such breakouts, and Bitcoin shot towards US$12,100 with just 12 days. After a brief pullback, bullish market forces were able to push Bitcoin up to almost US$12,500 by August 17th. However, this high point reached in mid-August has not been seen again to date.
Although Bitcoin held up quite well at elevated levels between US$11,100 and US$12,000 over the following two weeks, since September 1st the bears have been taking over control. The sharp sell-off in US tech stocks such as Tesla (-34% in 4 days) led to cross-sector profit taking and short-term panic. Bitcoin prices suddenly lost ground and fell sharply down to US$9,830. Likewise, Ethereum and the booming DeFi-sector entered a sharp correction relatively sudden as well, which also contributed to the short-term shock.
In the meantime however, the crypto sector has already regained its footing and Bitcoin is trading at just under US$10,900, and hence staged a significant recovery (+11.4%) above the psychological mark of US$10,000.
Technical Analysis For Bitcoin
(Click on image to enlarge)

Bitcoin Weekly Chart as of September 17th 2020, Source: Tradingview
On the weekly chart, Bitcoin has been able to overcome the downtrend that had emerged since the beginning of 2018 over the past two months. One after the other, the fan consisting of three downtrending lines was overcome. What is still missing would be a higher high compared to summer 2019, i.e. prices above approx. US$13,800. The big picture is thus only slowly but steadily improving. This next necessary relief with prices above US$13,800 would likely activate a rally towards the all-time high at US$20,000. After that, a breakout above 20,000 USD and thus a new all-time high would be necessary for Bitcoin to officially return to its longterm bull market.
Another striking feature of the weekly chart is that Bitcoin prices do not really want to let go of the multi-year uptrend line (in grey). Although the undercut in March caused the corona crash (technically speaking), in July Bitcoin was already trading above this old trend line again. The relapse below in the last two weeks does not look tragic in the big picture. The already mentioned downtrend fan should most likely absorb this pullback in the range of US$8,500 to US$9,800.
The Stochastic Oscillator has an active sell signal
Somewhat negative however is the active sell-signal from the Stochastic Oscillator. This makes it clear that the pullback is probably not over yet. A really good contrarian buy-signal based on a strongly oversold weekly stochastic is still at least a few weeks away and would require futher price decrease.
In this respect, the weekly chart in the run-up to the US elections suggests a somewhat confusing consolidation between US$9,500 and US$12,000. If the renewed breakout above US$12,500 is successful, the Bitcoin bulls will only have to overcome the resistance around US$13,500 and US$14,000 to generate enough momentum for a first attack on the all-time high at US$ 20,000. On the downside, prices down to US$8,500 are conceivable, but not very likely. The round psychological number of US$10,000 should be difficult to break on a weekly and especially monthly closing price basis. Short-term dips towards US$9,900 to 9,000 are still possible, however, and would offer a pretty good buying opportunity!
(Click on image to enlarge)

Bitcoin Daily Chart as of September 17th 2020, Source: Tradingview
On the daily chart, Bitcoin started a first countermovement or recovery in the last three days. This quickly reached the resistance zone around US$11,000. Despite the short-term breather, the recovery is likely to continue. Especially the buy-signal from the Stochastic Oscillator still has enough room to run substantially, hence in the coming days and weeks prices around US$11,500 to US$ maybe even 12,000 should be possible without too much of a problem.
However, at US$11,870, the upper Bollinger Band would increasingly prevent the bulls from advancing. A further fall back towards US$10,000 and a little lower would probably be the consequence. Ideally, there would then be a reunion with the rising 200-day moving average (US$9,155) in October or November. This could ultimately serve as a springboard for the next rally and thus significantly higher prices!
(Click on image to enlarge)
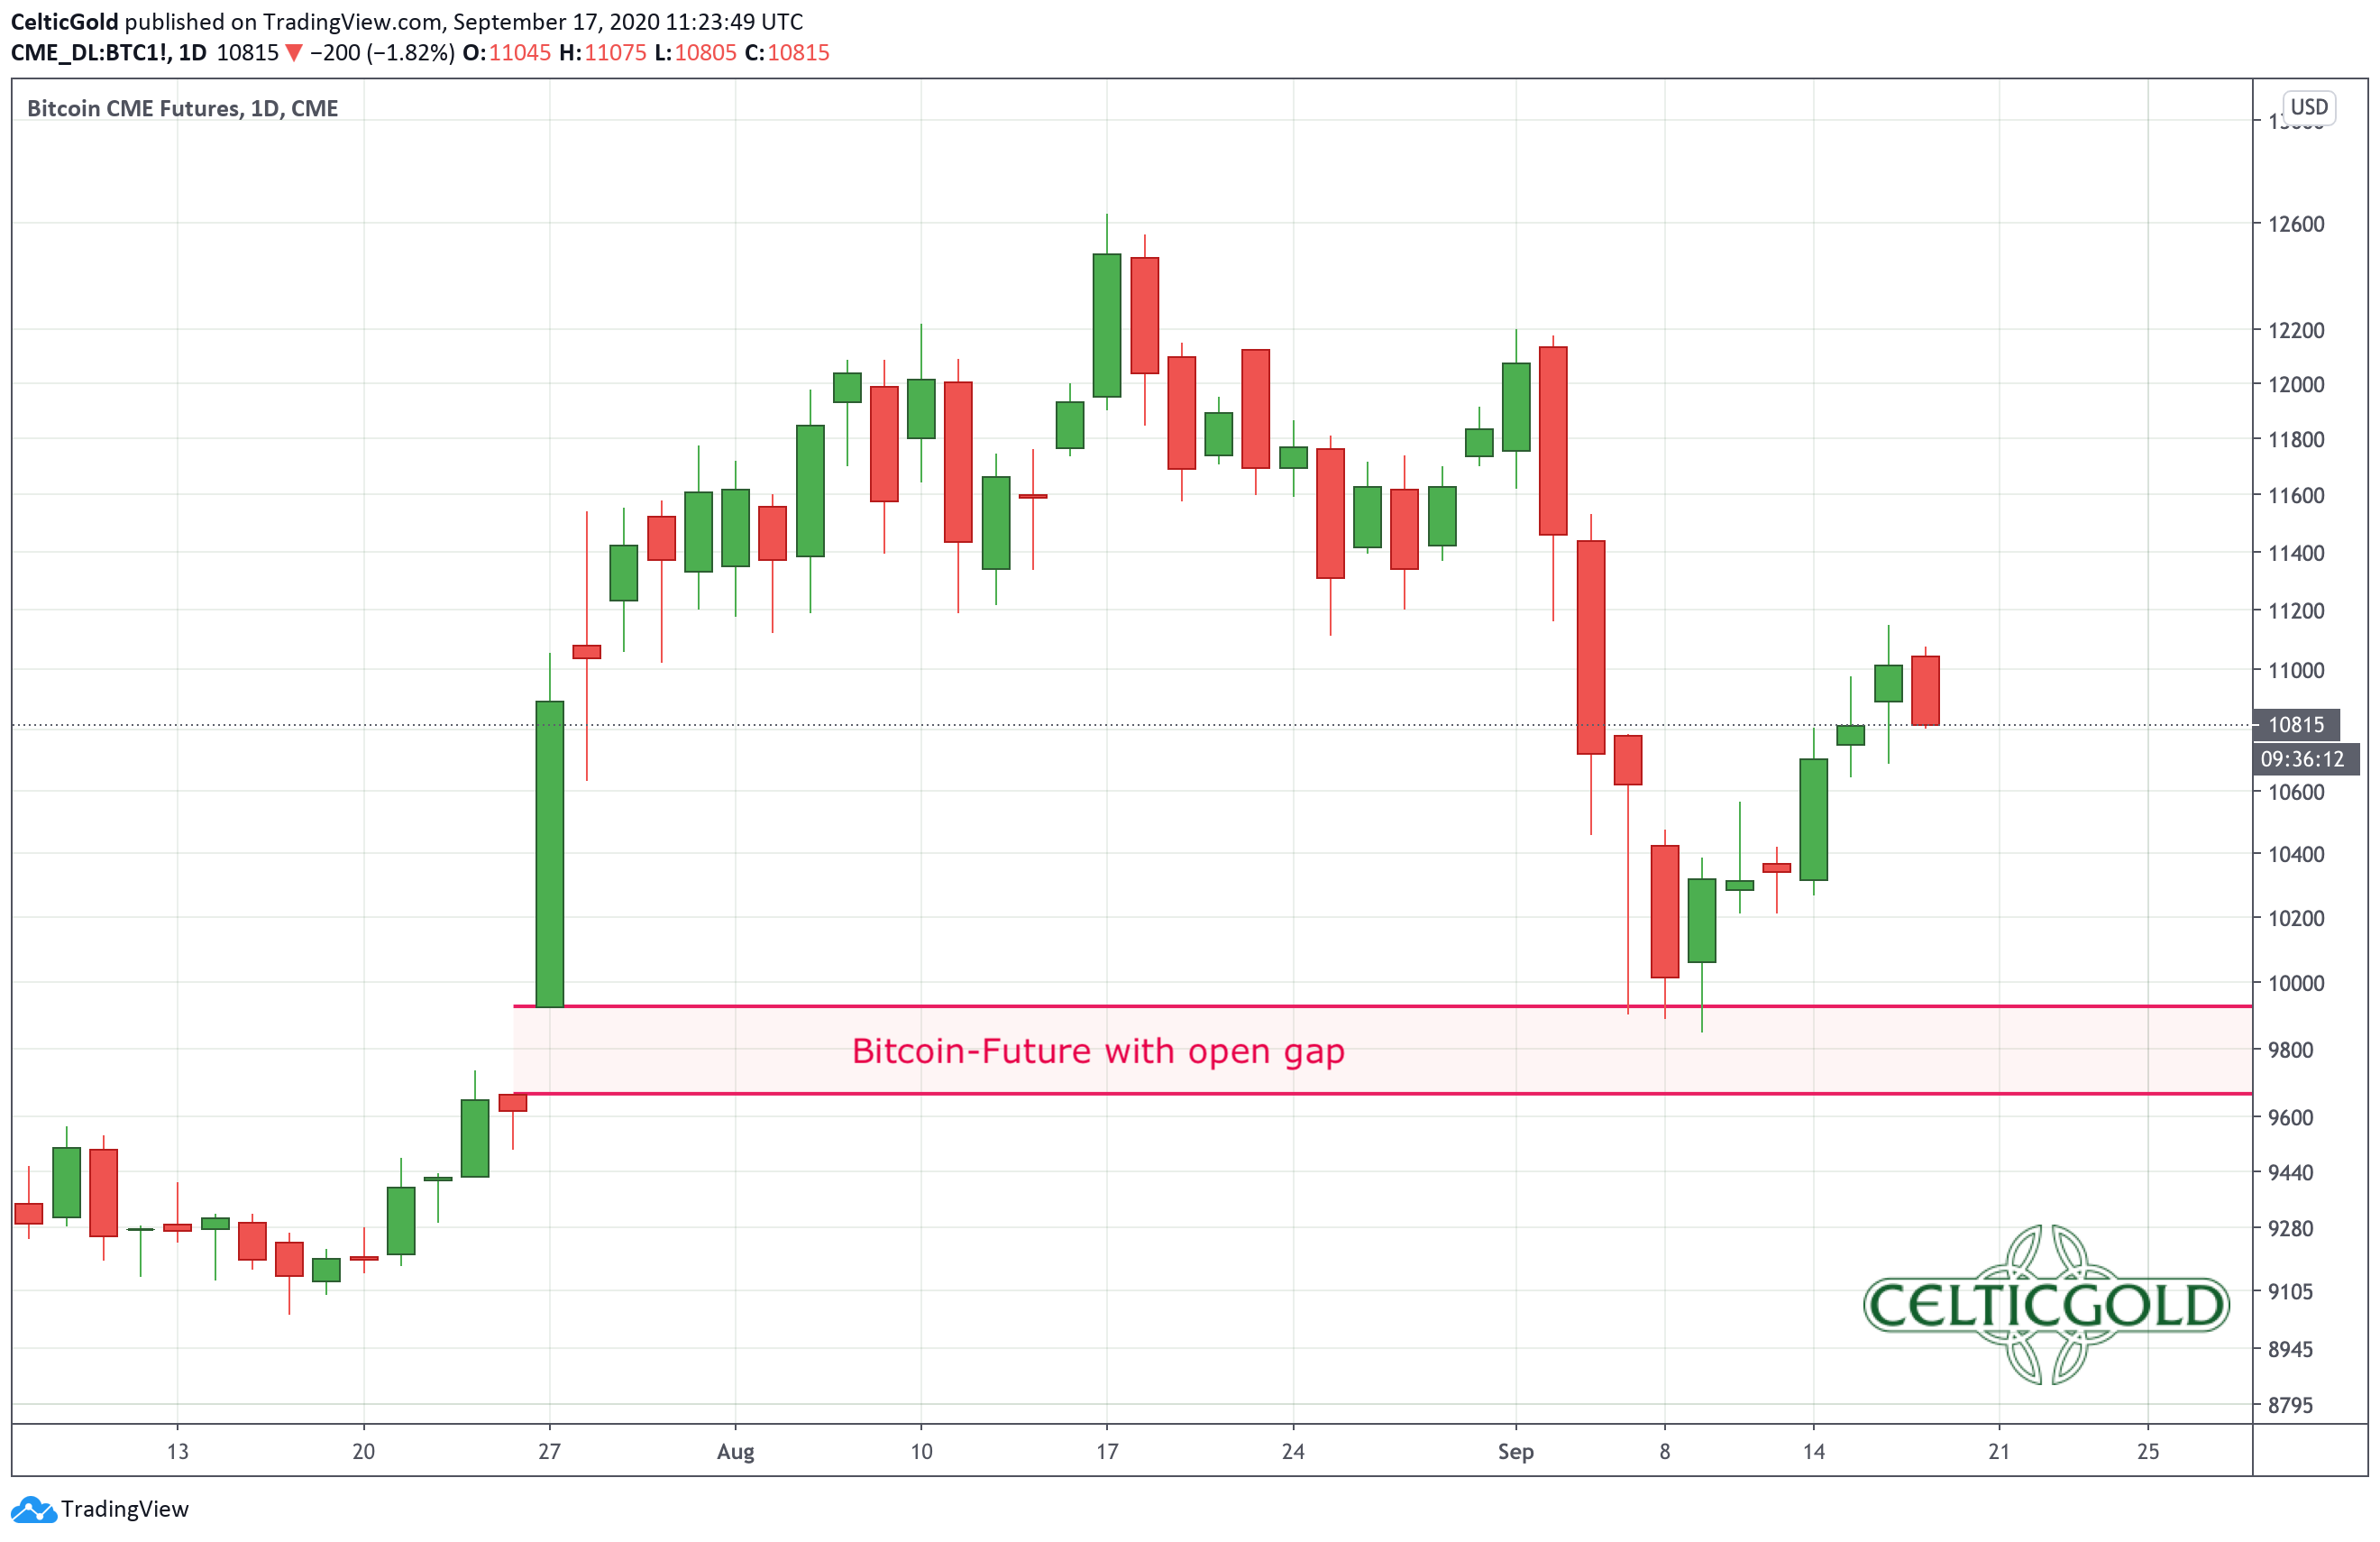
Bitcoin CME Future, Daily Chart as of September 17th 2020, Source: Tradingview
A look at the daily chart of the Bitcoin CME Future shows that the open gap between US$9,670 and US$9,920 has not really been closed during the pullback on September 9th. This probably requires another pullback, which would have to be a little lower than the first one.
In conclusion, the daily chart is bullish in the short term and the ongoing recovery has a good chance of climbing one floor higher. However, the correction is likely to continue, and the price will probably drop back towards and maybe one more time below US$10,000. With a reset of the rising 200-day moving average, the open gap in the Bitcoin future would be certainly closed and all the ingredients for a new big upswing would be in place. Alternatively, Bitcoin could directly break above US$12,000 in the coming weeks, which would then open up the way towards US$13,800 to US$14,000.
Commitments of Traders Report For Bitcoin
(Click on image to enlarge)
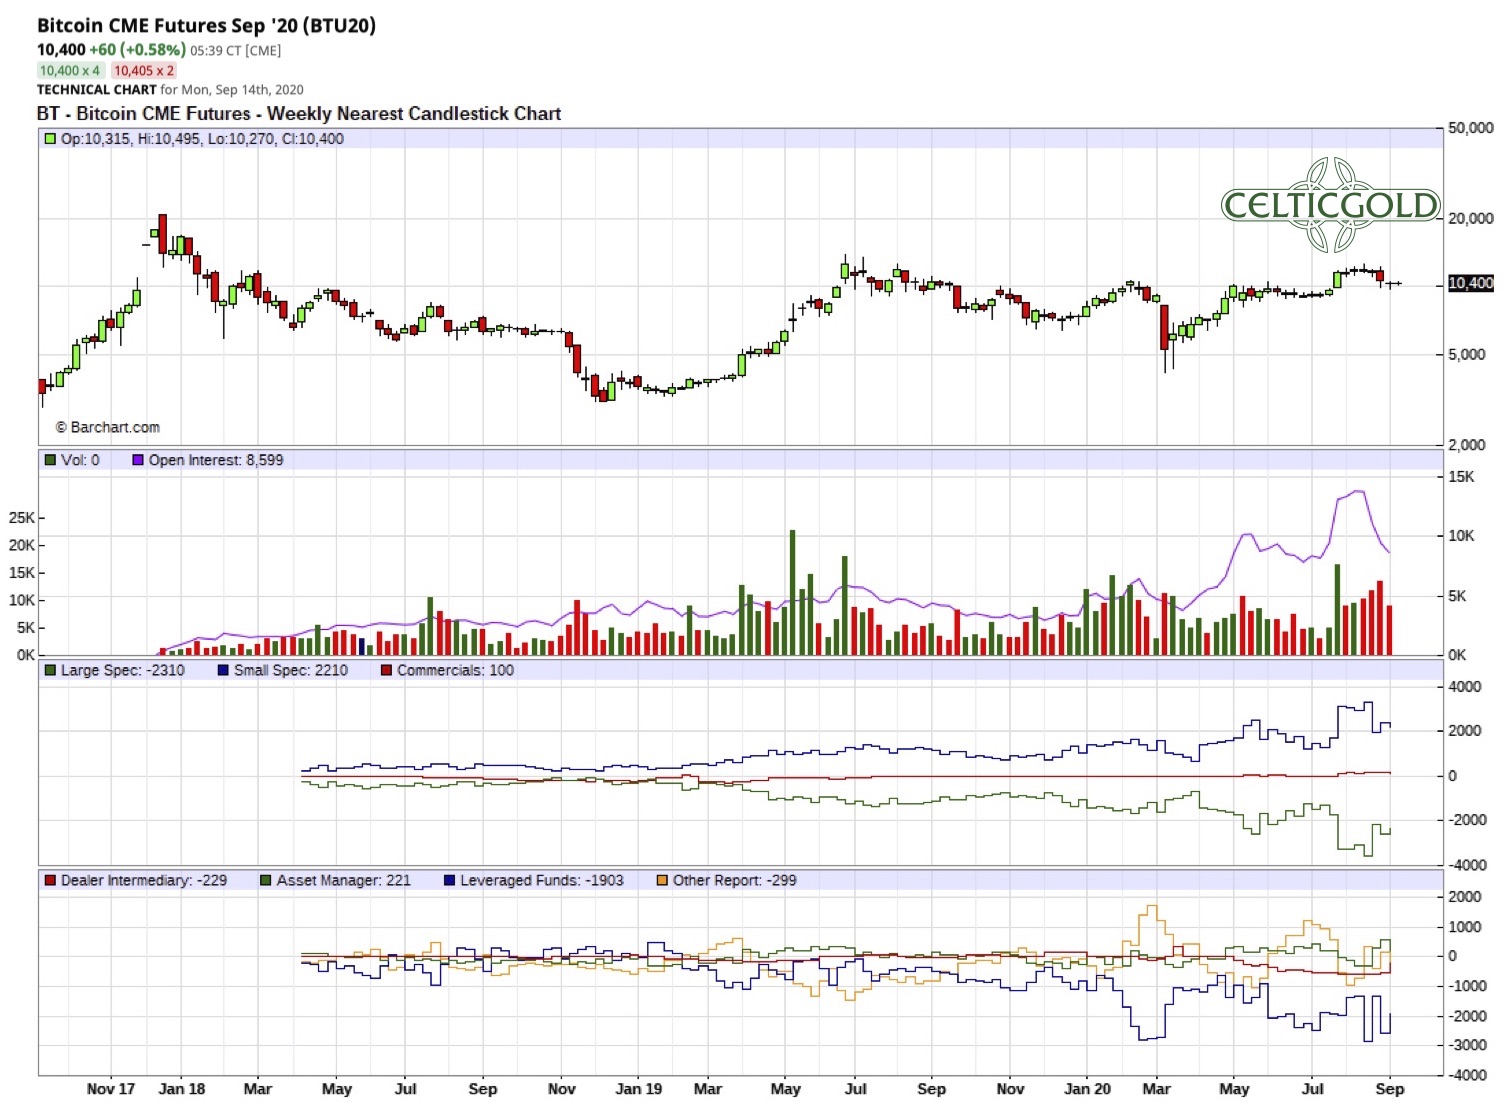
Bitcoin CME Future CoT-report, as of September 11th, 2020. Source: Barchart
Although Bitcoin futures have only been trading since December 17th, 2017, the CoT report (Commitment of Trades), which is published every Friday evening, offers an interesting overview of the positions and is definitely a helpful tool to analyze the Bitcoin market. However, I must mention that the overall trading volume is still relatively low. Note as well that the bitcoin future with the symbol XBT is trading at the CBOE, while the symbol BTC refers to the CME.
According to this Cot Report the so-called subgroup “Other Reportables”, which can certainly be described as the “smart money”, is currently positioned more or less neutrally. From this perspective, no major price advance is to be expected. The “leveraged funds”, on the other hand, are holding an increased short position and are thus opposing the general uptrend.
In summary, the current CoT report provides a rather neutral positioning and thus rather suggests a continuation of the consolidation between approx. US$9,000 and US$12,000.
Sentiment Bitcoin – Take Advantage Of Any Dip Below 10K!
(Click on image to enlarge)
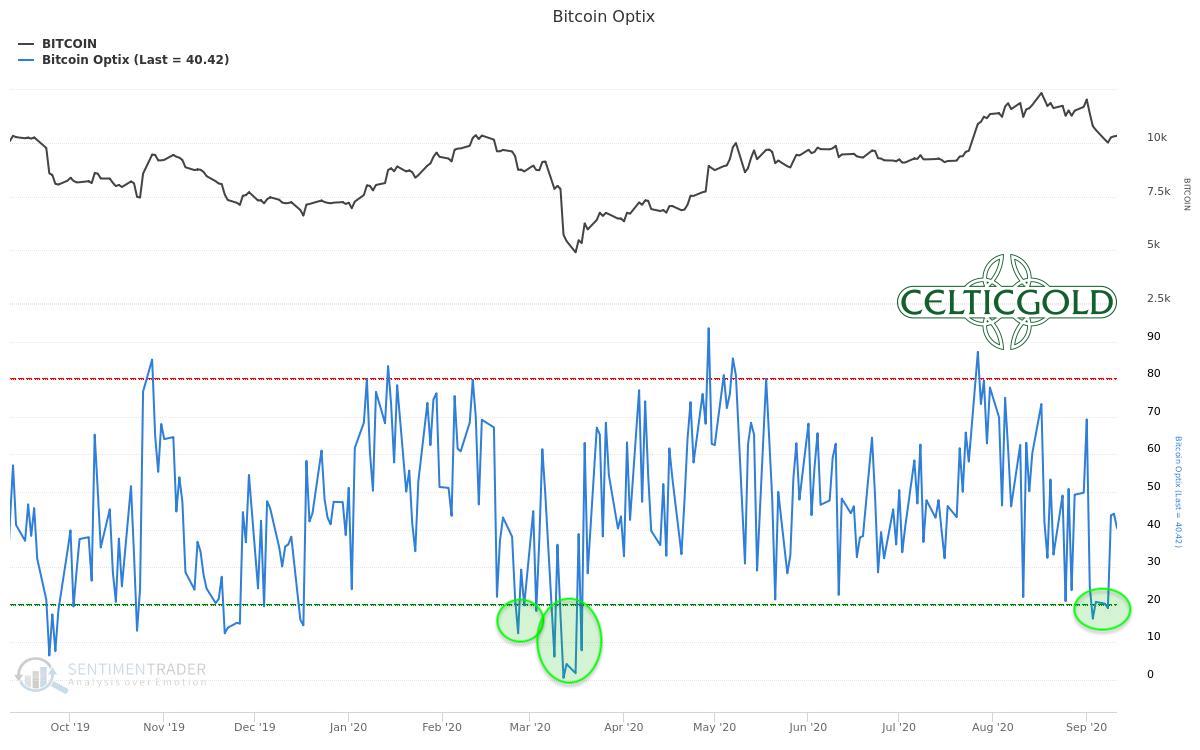
Bitcoin Optix as of September 16th, 2020, 2020. Source: Sentimentrader
(Click on image to enlarge)
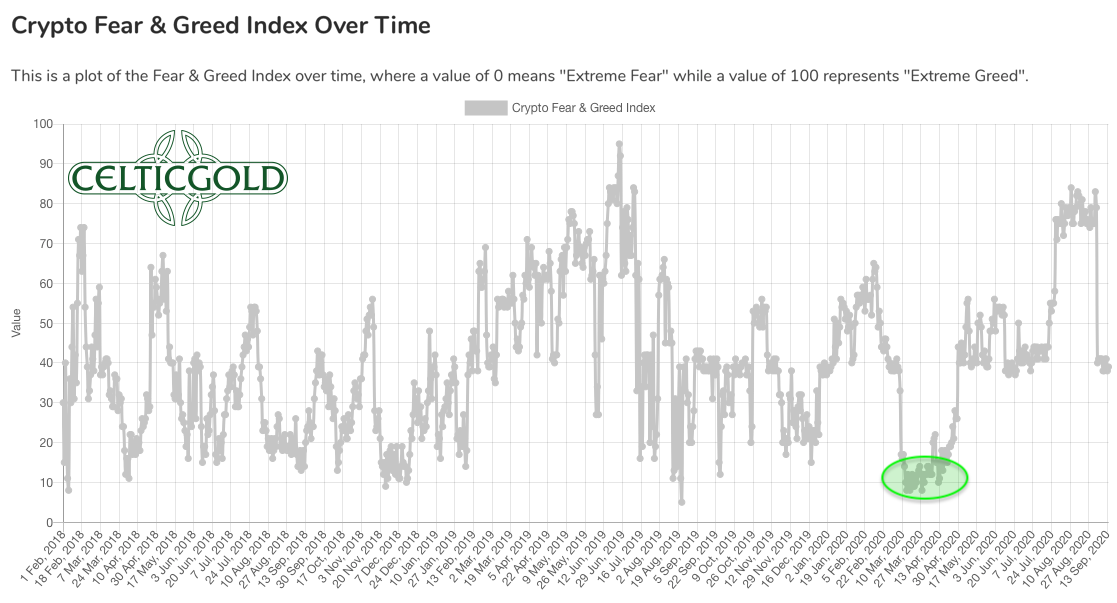
Crypto Fear & Greed Index as of September 17th, 2020. Source: Crypto Fear & Greed Index
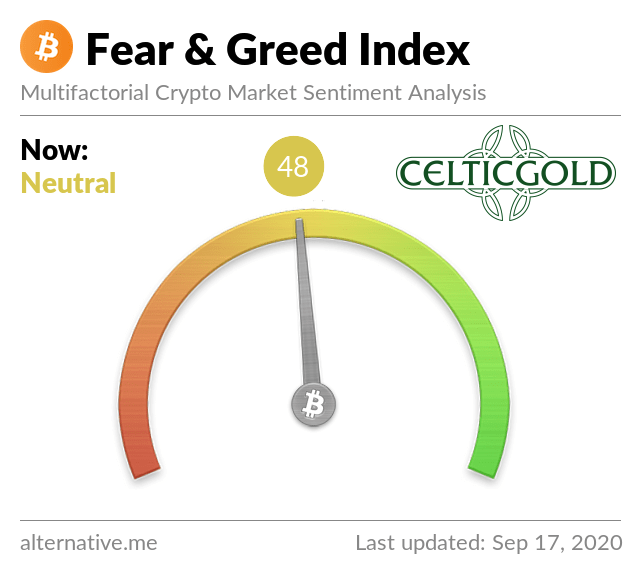
Crypto Fear & Greed Index as of September 17th, 2020. Source: Crypto Fear & Greed Index
The sentiment data recently showed slightly increased anxiety but have now moved back to neutral again. According to the Bitcoin Optix from Sentimentrader, the mood has already been able to recover significantly in the last few days from a temporary extreme value. The sophisticated “Fear & Greed Index”, on the other hand, reported “fear in the crypto sector” for a fortnight, without reaching earlier extreme panic states so far.
Overall, a slightly pessimistic perception has spread in the crypto sector. However, there can be no talk of a genuine contrarian buying opportunity due to extreme panic. This would probably require Bitcoin prices well below US$ 10,000. In any case, sentiment in the crypto sector is currently not overheated but has slightly cooled down, which means that one should rather look for buying opportunities and bargains.
Seasonality Bitcoin – Take Advantage Of Any Dip Below 10K!
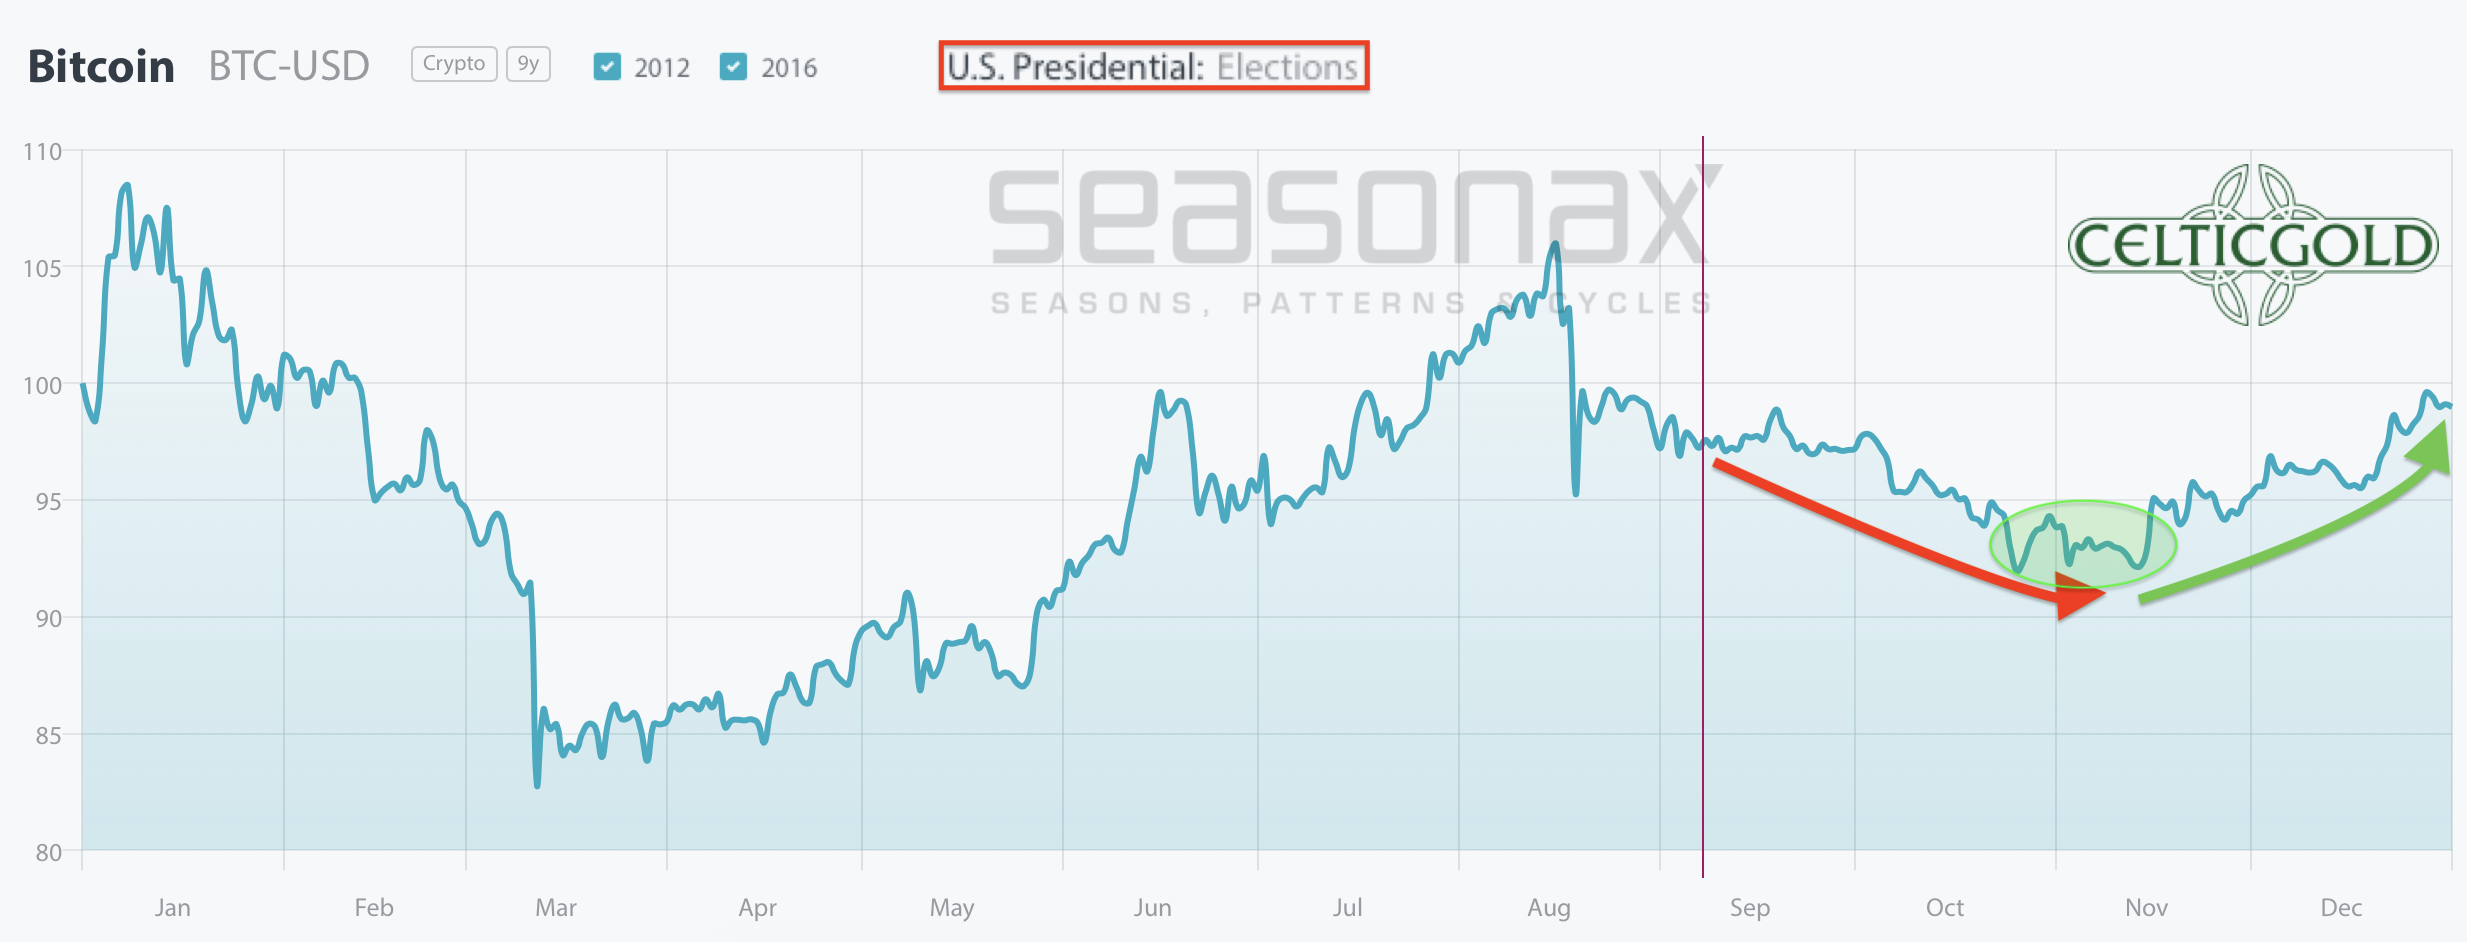
Bitcoin seasonality in US election years. Source: Seasonax
The Presidential election in the United States on Tuesday, November the 3rd 2020 will undoubtedly be the most important event for the rest of this year. The impact of the elections, and in particular the fierce campaign, is likely to increase week by week. Accordingly, the next six and a half weeks are likely to be rather rough and probably difficult. Neither the stock markets nor Bitcoin will be able to escape this. Although the Fed will certainly tend to increase its money supply expansions in order to avoid public unrest before the elections, the political climate is so poisoned that all kinds of horror scenarios are conceivable.
Unfortunately, there is only a minimal data series available so far to analyze Bitcoin´s price behavior in the US election years. Based on the price behavior in 2012 and 2016, no statistical probability can yet be deduced.
However, if Bitcoin would resemble those two years, weakness should be expected in the coming weeks until the election. The seasonal omens would not return to a sustainable green until mid-November.
Bitcoin against gold
(Click on image to enlarge)
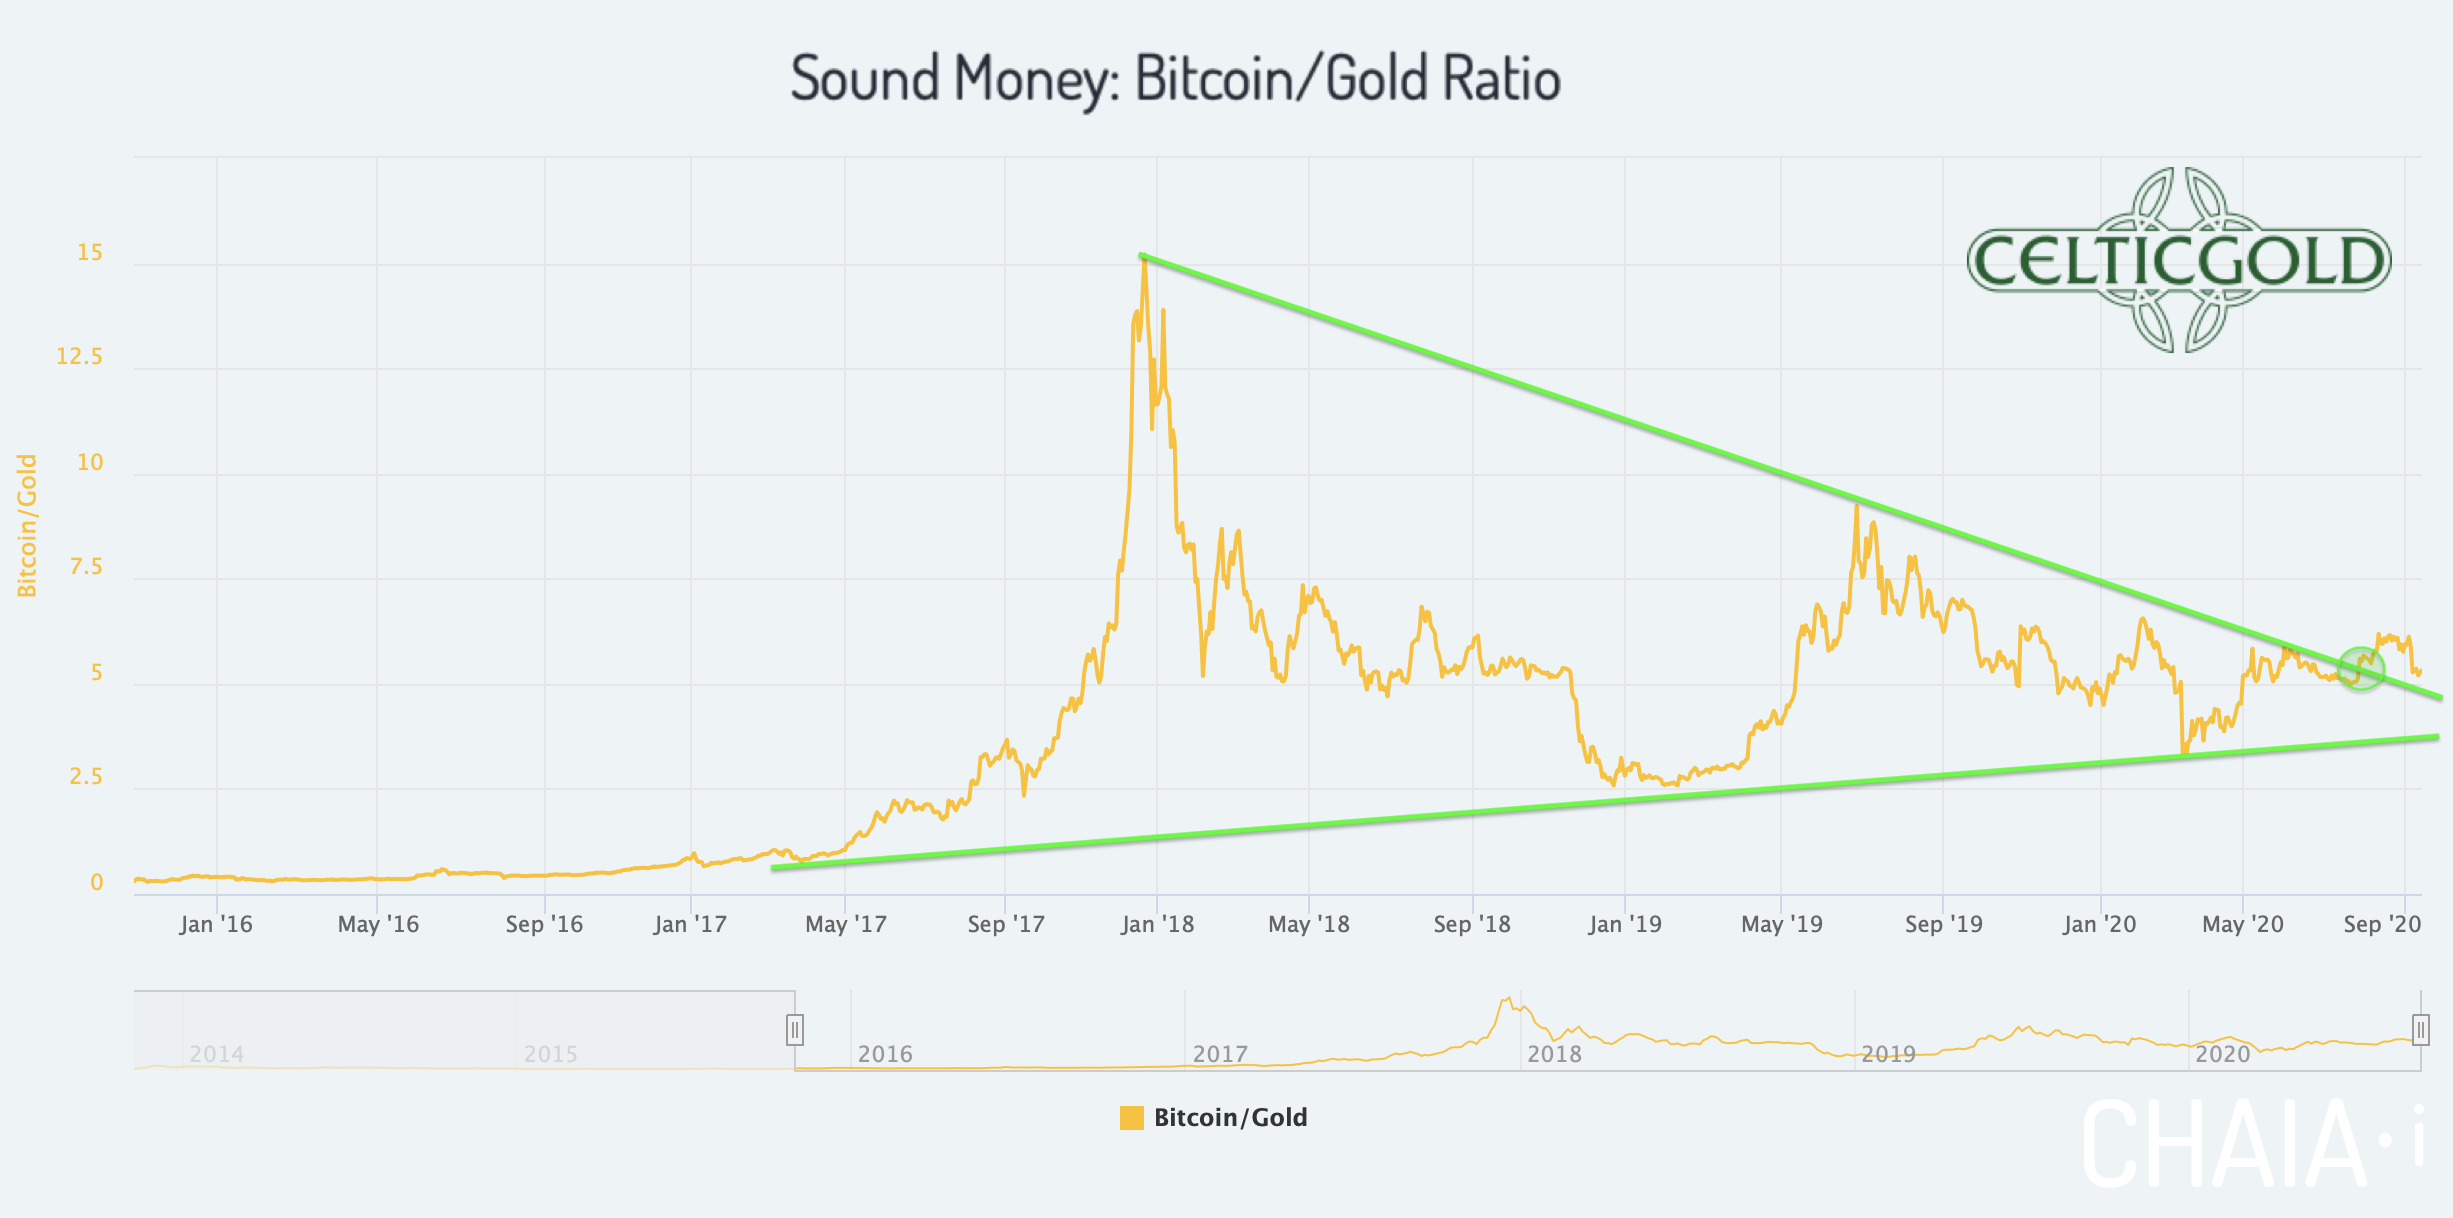
Sound Money Bitcoin/Gold-Ratio as of September 17th, 2020. Source: Chaia
At prices of US$10,900 for a Bitcoin and US$1,945 for a troy ounce of gold, the Bitcoin/Gold-ratio is currently at 5.6, meaning that you have to pay 5.6 ounces of gold for a Bitcoin. In other words, a troy ounce of gold currently costs 0.178 Bitcoin.
At the end of July, Bitcoin broke out of the large triangle against gold. Despite the strong gold price, the Bitcoin/Gold-ratio quickly rose to 6.1. With the correction since the beginning of September, however, the ratio has clearly fallen back and is currently testing the upper edge of the former triangle. Should this reset or test with values between approx. 4.8 and 5.5 confirm the breakout over the coming weeks, the ratio could go much higher afterwards. Then Bitcoin should again outperform the gold price by a wide margin. So far, however, the breakout from the-two-and-a-half year consolidation triangle has not yet been able to create any sustainable momentum in favor of Bitcoin.
You want to own Bitcoin and gold!
Generally, buying and selling Bitcoin against gold only makes sense to the extent that one balances the allocation in those two asset classes! At least 10% but better 25% of one’s total assets should be invested in precious metals physically, while in cryptos and especially in Bitcoin one should hold at least between 1% and of 5%. If you are very familiar with cryptocurrencies and Bitcoin, you can certainly allocate much higher percentages to Bitcoin on an individual basis. For the average investor, who is normally also invested in equities and real estate, 5% in the still highly speculative and highly volatile Bitcoin is already a lot!
Opposites compliment. In our dualistic world of Yin and Yang, body and mind, up and down, warm and cold, we are bound by the necessary attraction of opposites. In this sense you can view gold and bitcoin as such a pair of strength. With the physical component of gold and the digital aspect of bitcoin you have a complimentary unit of a true safe haven for the 21st century. You want to own both! – Florian Grummes
Conclusion: Bitcoin – Take Advantage Of Any Dip Below 10K!
(Click on image to enlarge)
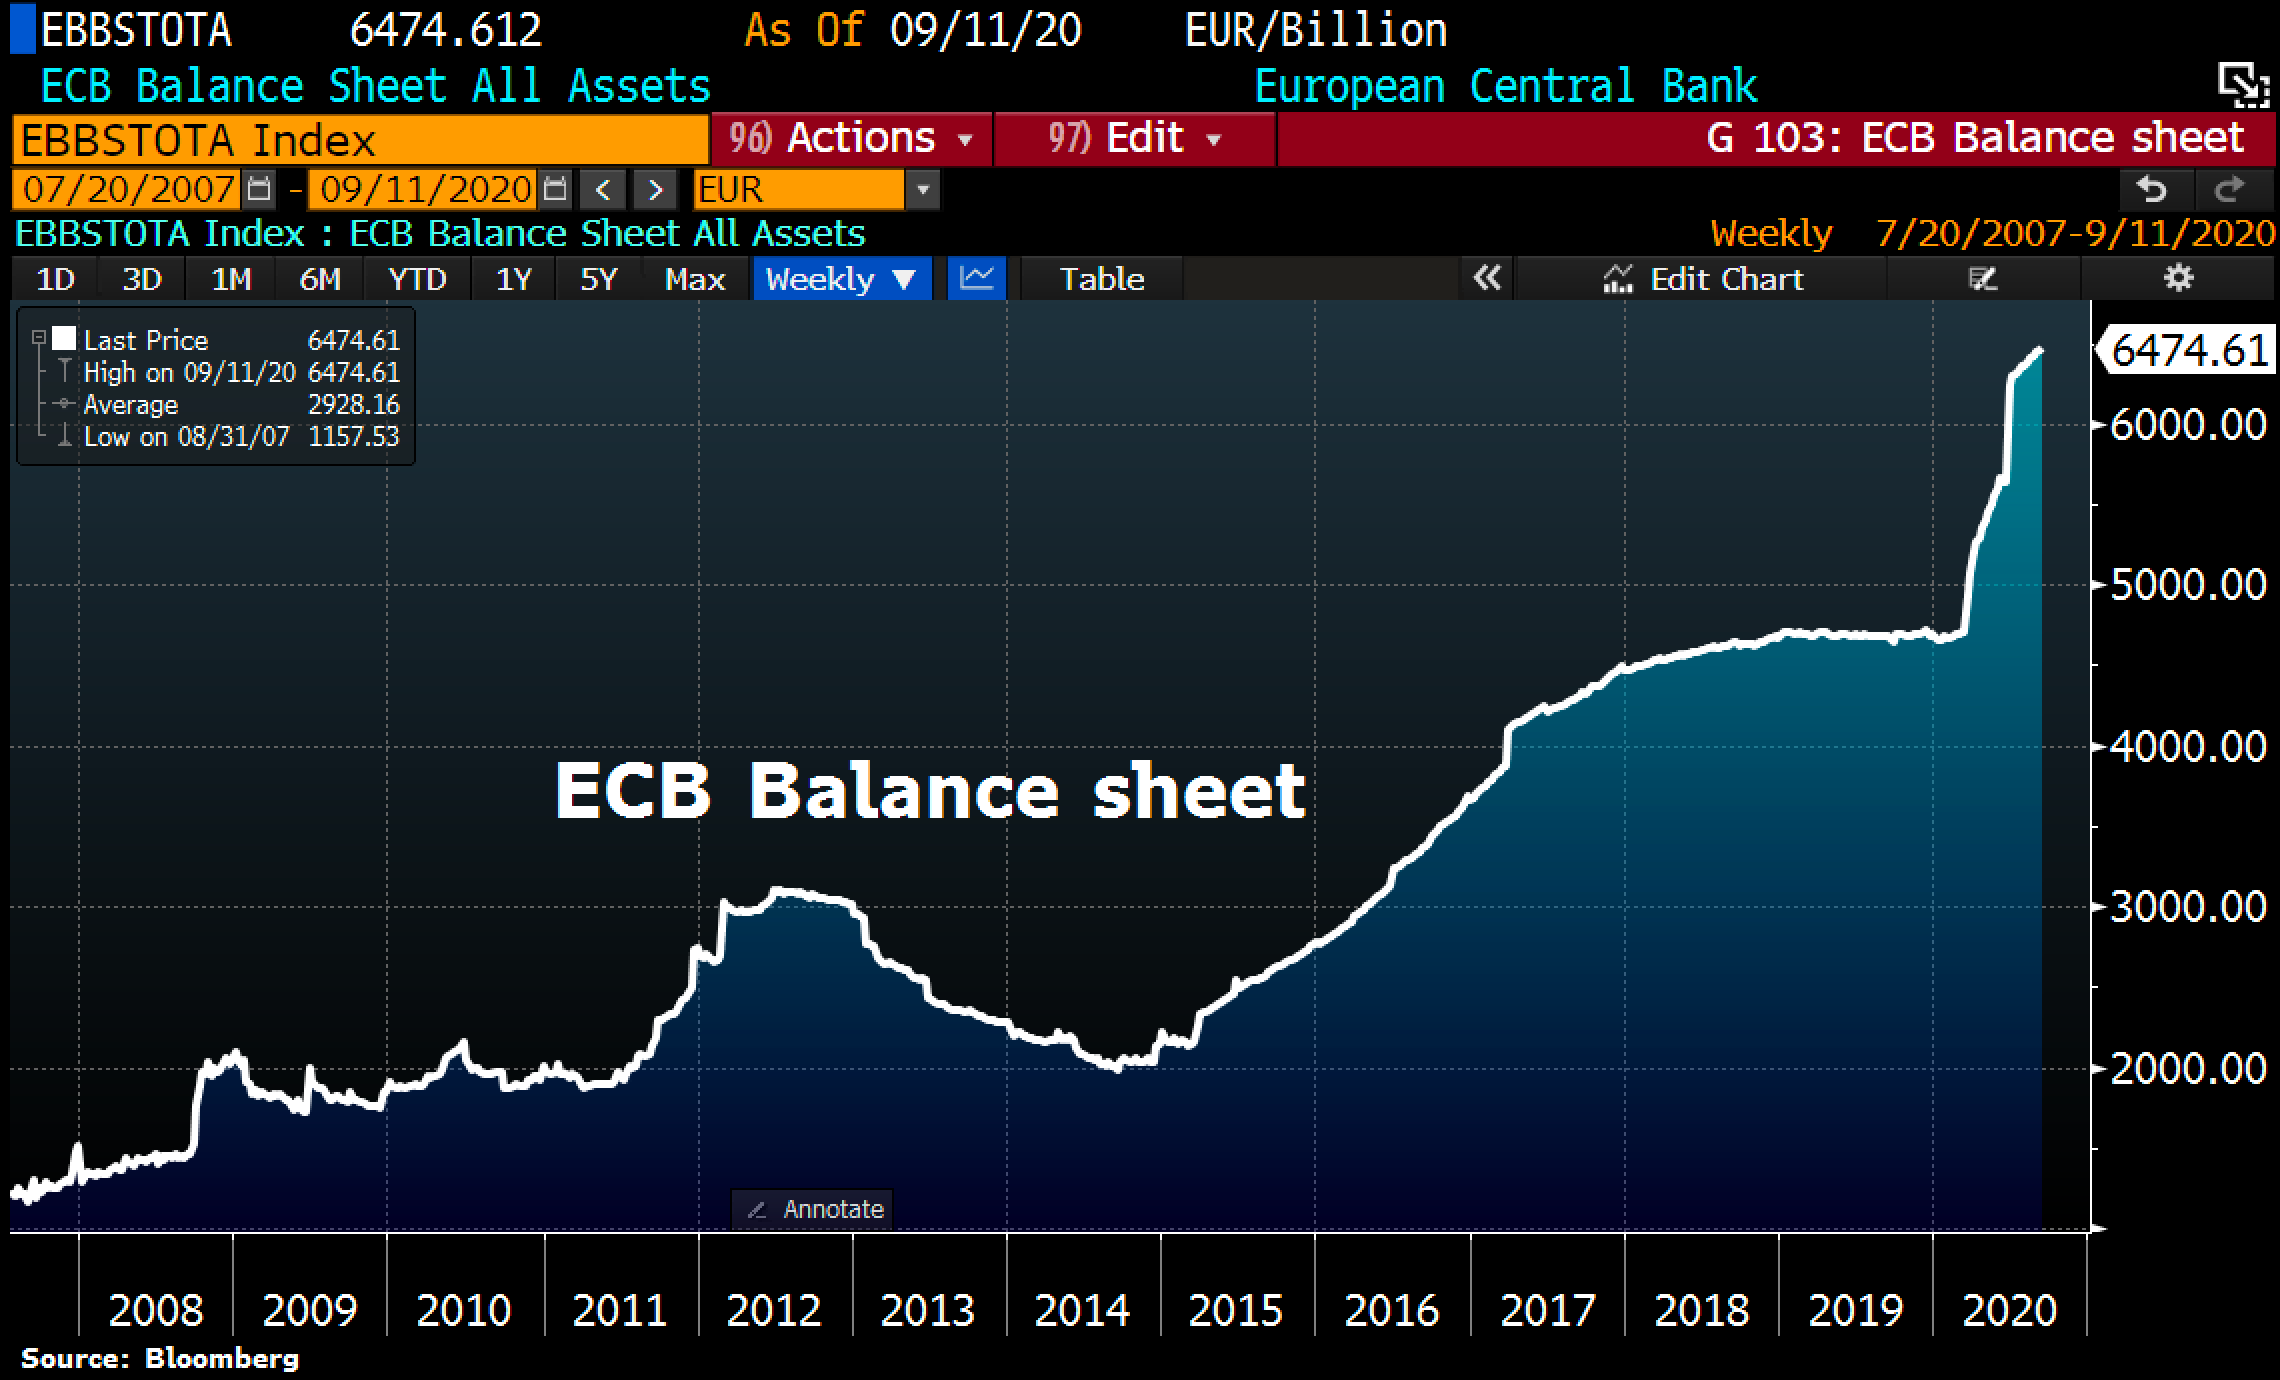
©Holger Zschaepitz, Schuldensuehner, 15th of September 2020
The ECB’s balance sheet total recently rose once again to a new all-time high of 6,474.61 billion Euro. Overall, assets rose again by 15.8 billion Euro compared with the previous week. Madame Lagarde is thus maintaining her rhythm of money creation of around 10 – 30 billion Euro per week! The ECB balance sheet now represents 63.5% of euro-zone´s GDP.
(Click on image to enlarge)
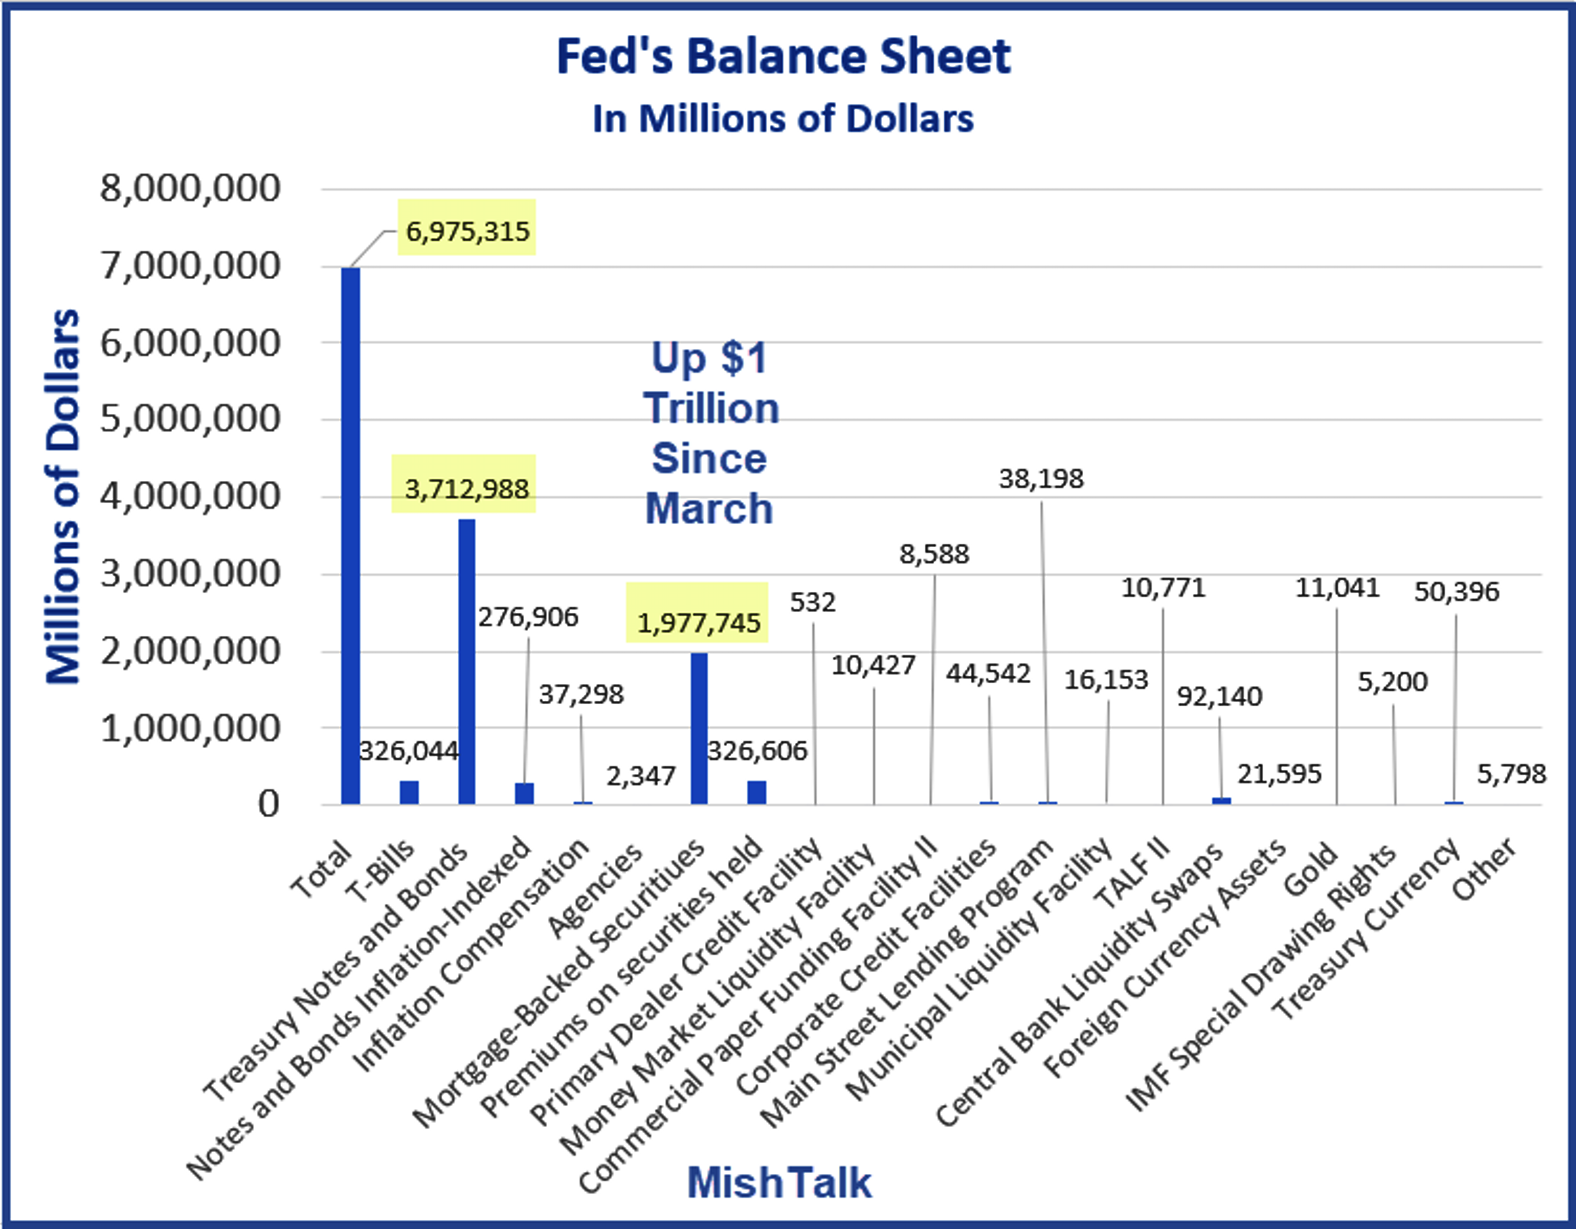
©MishTalk, 2nd of September 2020
The balance sheet total of the FED is also increasingly getting out of control, amounting to almost US$7 trillion. Of this amount, just under US$3.7 trillion in the form of bonds or debentures and almost US$2 trillion in the form of mortgages (Fannie Mae, Freddie Mac or Ginnie Mae). So there is no end in sight to the Fed’s mortgage frenzy. On the contrary, since March, the Fed has issued mortgage bonds worth trillion of dollars. In March and April, the Fed also bought about US$300 billion of bonds and has been buying about US$ 100 billion more every month since then. The Fed now owns almost a third of the bonds backed by US home loans! As a result, mortgage rates have fallen further, bringing the average 30-year interest rate down from 3.3% at the beginning of February to 2.91% most recently. These purchases were eight times faster than under previous Fed programs (then called quantitative easing). If the Fed maintains its current pace of buying, it will own about 34% of the total US mortgage portfolio by the end of this year.
(Click on image to enlarge)
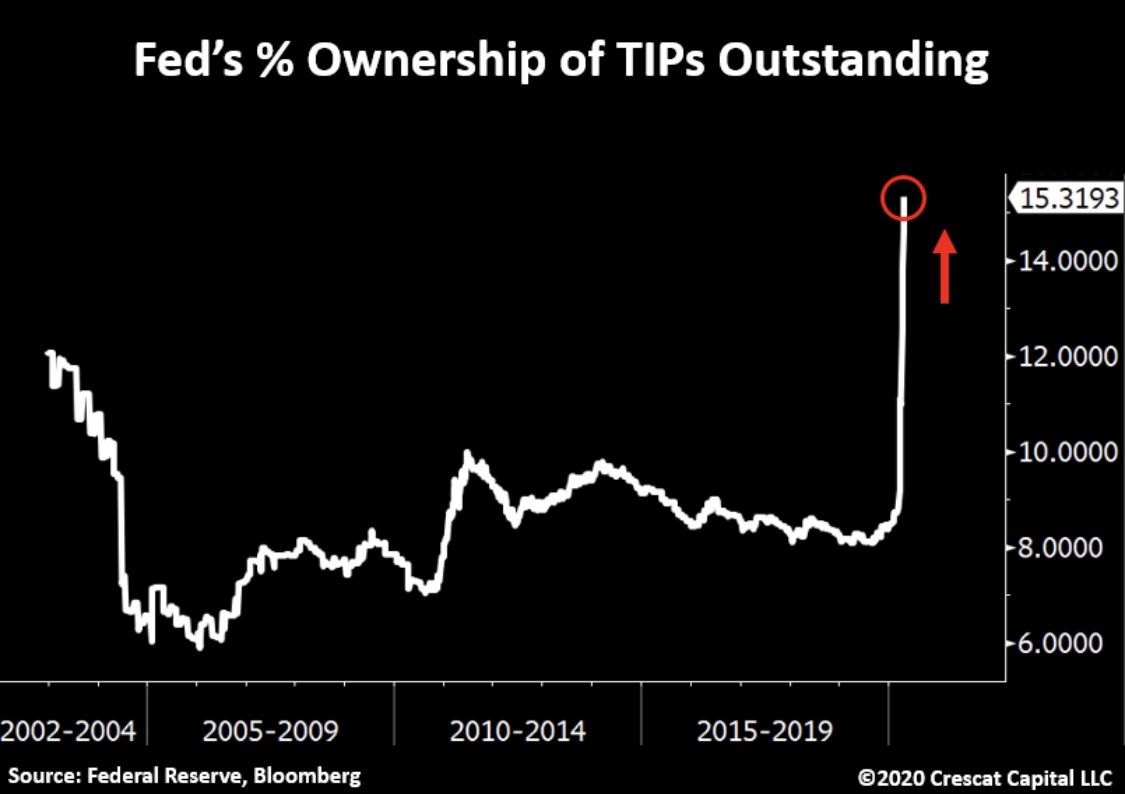
©Tavi Costa @Crescant Capital, 10th of September 2020
This trend appears to be irreversible and will most likely fuel inflationary expectations, as intended by the Fed. The expansion of the money supply to suppress free market forces and thus interest rates will and must continue, otherwise the financial system will implode. This will continue to destroy the purchasing power of the fiat currencies. For investments outside the financial system, i.e. for precious metals and Bitcoin, this fatal development is an explosive mix and is likely to result in significantly higher prices sooner or later.
Bitcoin, in particular, is still trading well below its all-time high and would first have to almost double in order to celebrate a new all-time high against all the fiat currencies, just like the price of gold recently did. From this perspective alone, Bitcoin is therefore highly interesting and probably significantly undervalued. In recent months, more and more professional and institutional investors have been buying and positioning themselves, while Bitcoin has hardly made an appearance in the mainstream over the past two years. Moreover, the boom in the DeFi sector is still in its infancy and has certainly not yet attracted much new money into the sector. Rather, it is primarily crypto freaks and programmers who are gambling together.
The next few weeks until the US election could be challenging
However, before the US elections and possibly even into December, the situation in the financial markets remains opaque and vulnerable. Even in this unprecedented crack-up-boom, volatile pullbacks are occurring to temporarily relieve the pressure in the boiler. Ultimately, however, fiat prices in all asset classes will continue to rise due to the unlimited and worldwide expansion of the currency supply. At the same time, Bitcoin has what it takes to outperform all other asset classes due to its digital scarcity.
In summary, with a little luck Bitcoin will offer another and possibly very last chance to buy below US$10,000 in the coming weeks. The open gap in the Bitcoin future and the magnetic attraction of the 200-day moving average could make this happen. Prices in the range between US$9,000 and US$10,000 would again represent a very good buying opportunity for Bitcoin in view of the foreseeable medium-term devaluation of purchasing power. Alternatively, the short pullback below US$10,000 was already the maximum the bears could achieve. In this case, we should be prepared for the violent breakout above US$12,000 very soon.
Disclosure: None.


