
Best Long-Term Performance Diversified Emerging Markets ETFs
The iShares MSCI Emerging Markets ETF (EEM) is the largest and one of the oldest available ETFs in the Emerging Markets asset class. It was launched on April 7, 2003. Since then, EEM has had a compounded rate of return of 10.39%. An S&P 500 index fund returned 9.44% CAGR over the same period. This outperformance came with a price though, and that price is called volatility. In the case of EEM, it’s standard deviation (a measure of volatility) was 21.97% while the S&P 500 was only 13.38% (lower means less volatility). Other ways to demonstrate how this volatility (risk) relates to performance (reward) are the Sharpe & Sortino ratios. Typically, the higher these ratios are, the better the risk vs reward ratio.
In the chart below, the S&P 500 funds’ Sharpe & Sortino ratios are both higher than EEM. So, with all this additional risk, why should long-term investors consider allocating part of their equity portfolio to Diversified Emerging Markets? My answer is diversification. Diversification has oft been quoted as the “only free lunch in investing”. As a long-term investor and an investment blogger, I have made it my mission to find and invest in as many different equity asset classes as possible without degrading long-term performance. It is my opinion that Diversified Emerging Market funds are a useful component of a worldwide equity portfolio because they have the potential to lift long-term performance while simultaneously reducing overall risk. The risk reduction can be found in this asset class’ correlation to U.S. Markets. Again referring at the chart below, EEM had a correlation to U.S. Markets of 0.79. This is a favorable number because the lower the number, the lower the correlation to U.S. Markets, that is, if the asset class does not perform poorly long-term.
EEM vs S&P 500 index fund: May 2003 – March 2019
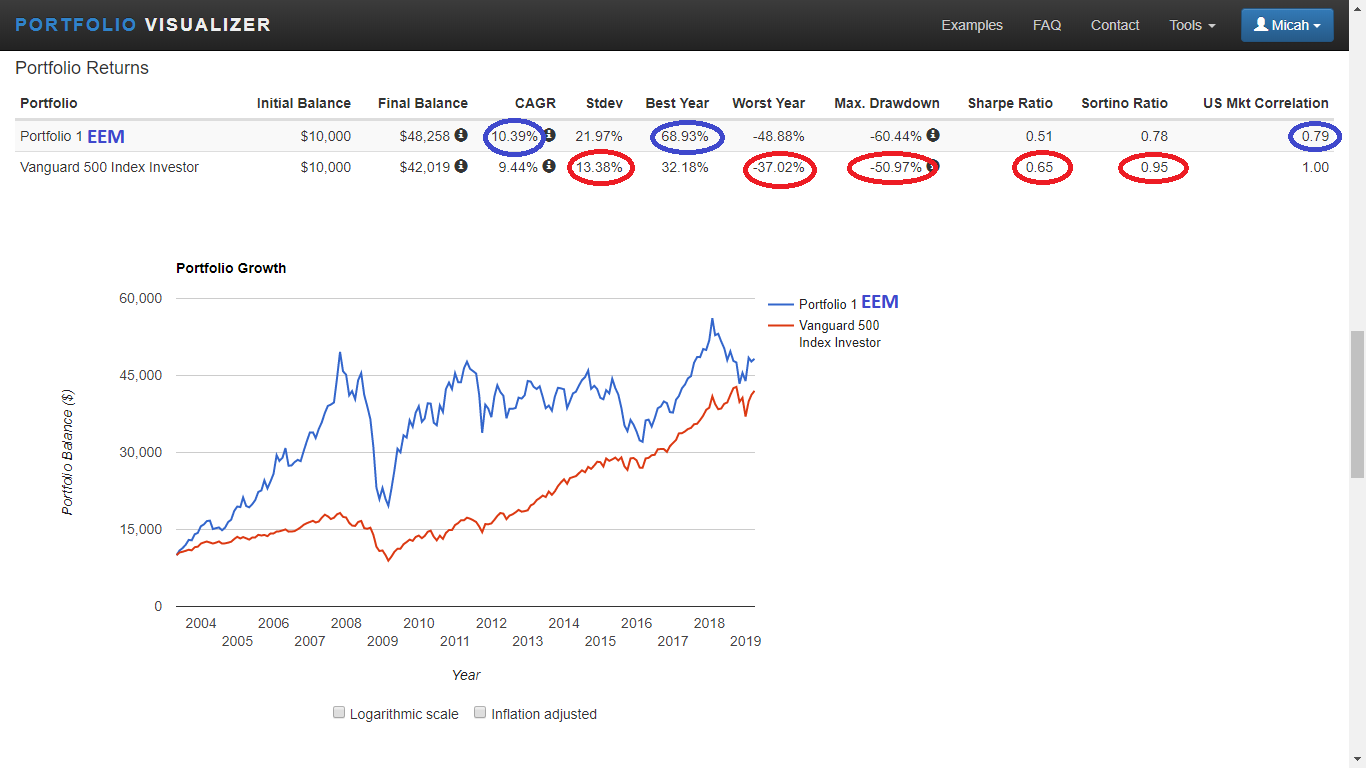
Source: portfoliovisualizer.com/
EEM vs SPY: April 11, 2003 – April 21, 2019
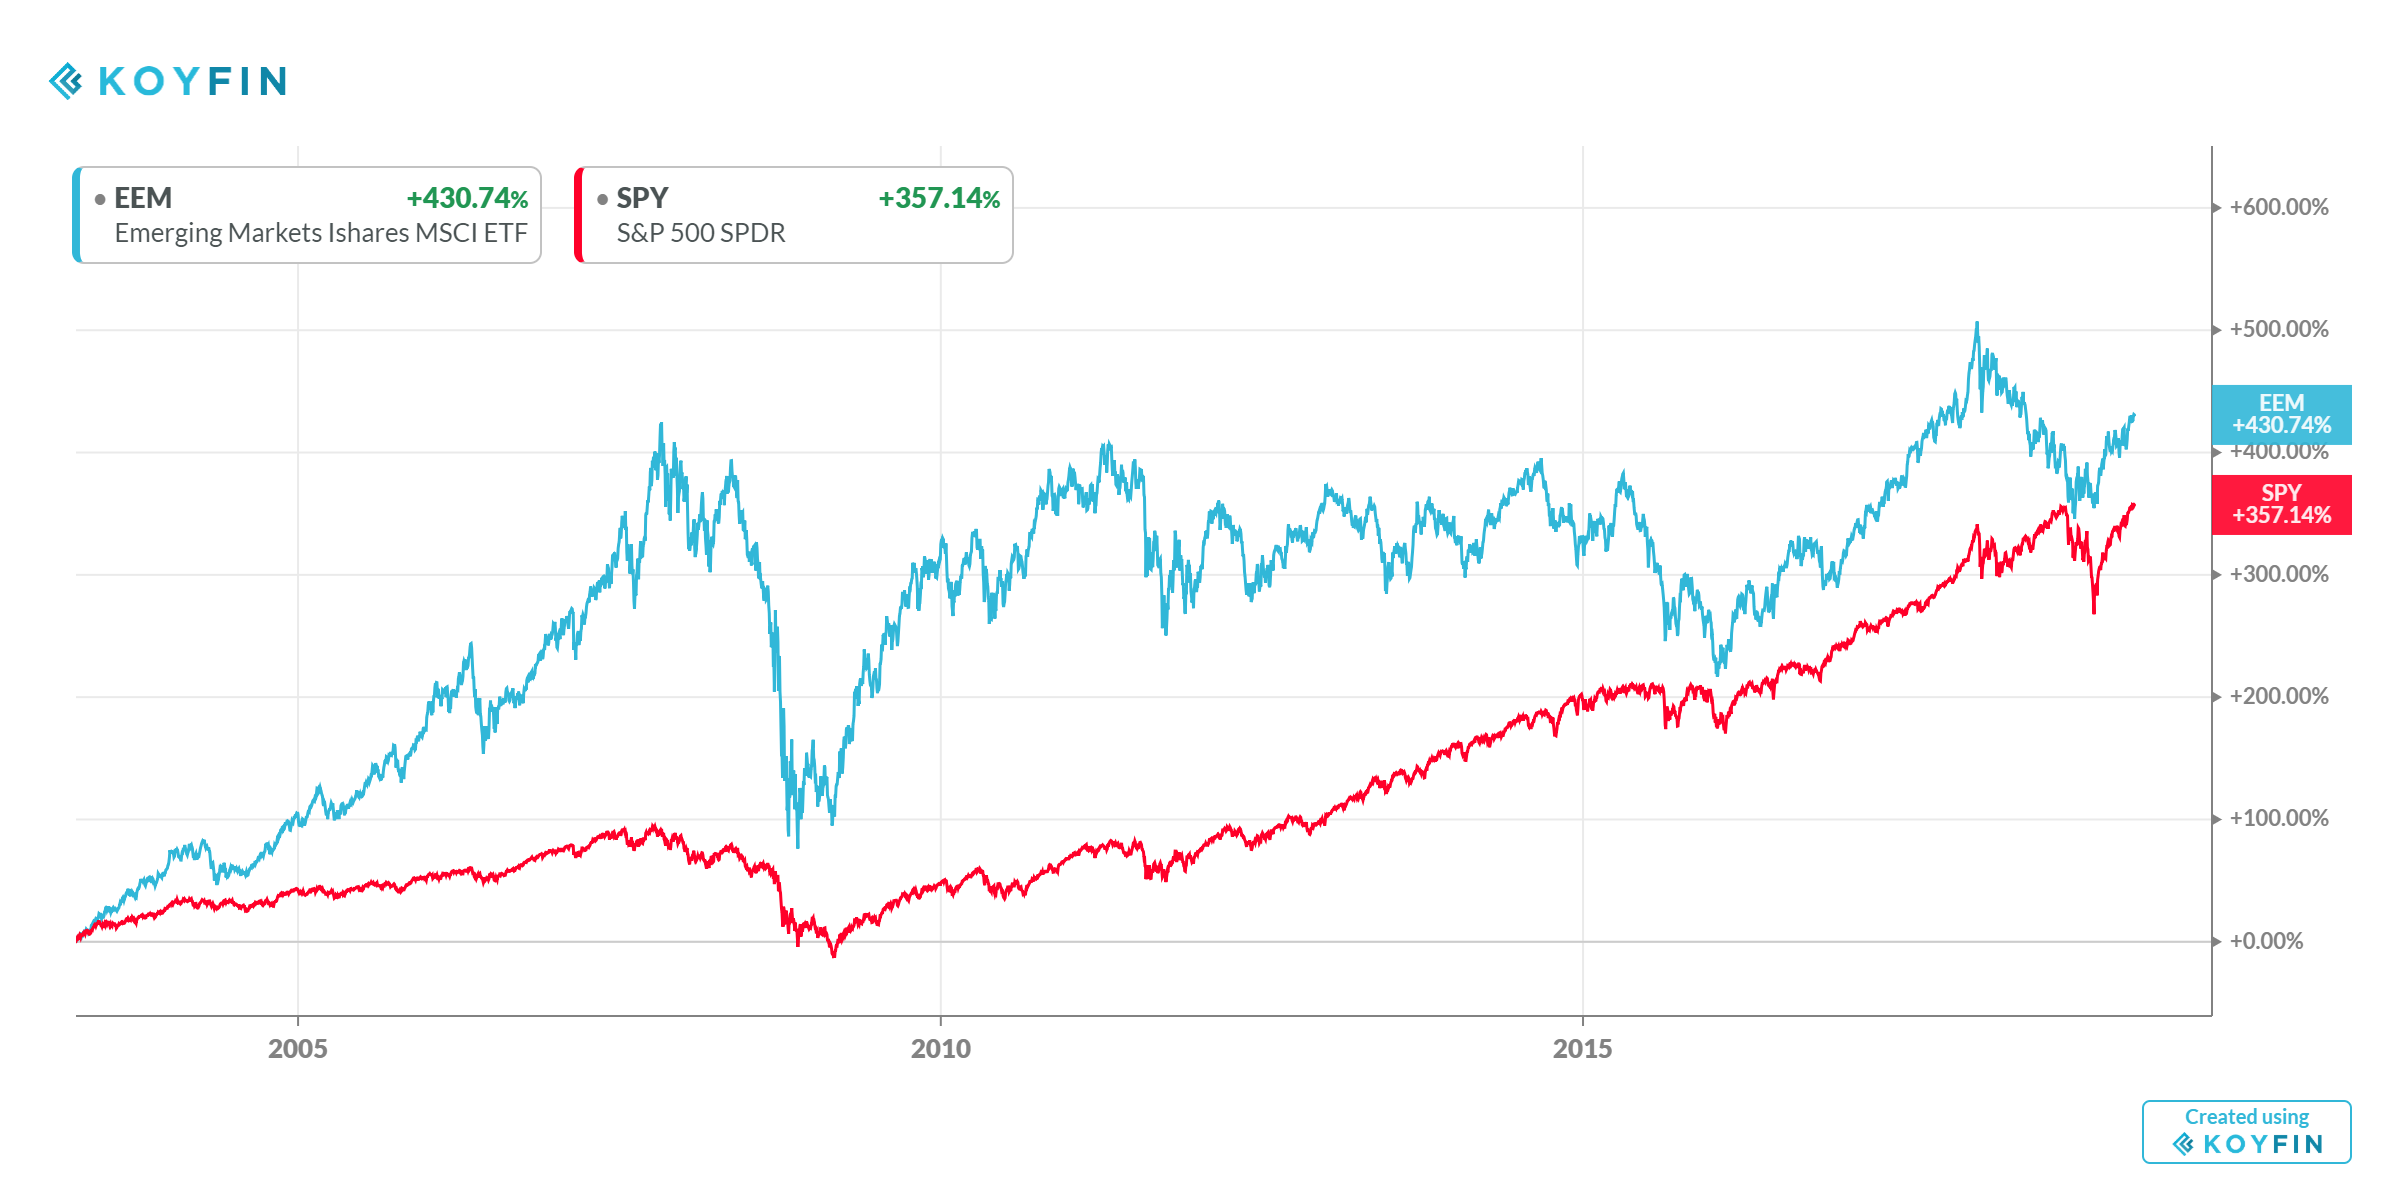
Source: koyfin.com/home
Since the ETF product is much younger than the mutual fund industry, let’s look at how an older Emerging Markets index mutual fund has performed for 20 years. EEM has been available for 16 years, but most long-term investors would prefer to see a 20-year timeframe, since we may be holding one of these funds in our portfolio for decades. For the 20-year back-test I have chosen the Vanguard Emerging Markets Stock Index Fund Investor Shares (VEIEX). In the chart below, you can see that VEIEX had similar volatility as EEM and about the same correlation to U.S. Markets, but the Sharpe & Sortino ratios did improve for the 20-year period.
VEIEX vs S&P 500 index fund: March 1999 – March 2019
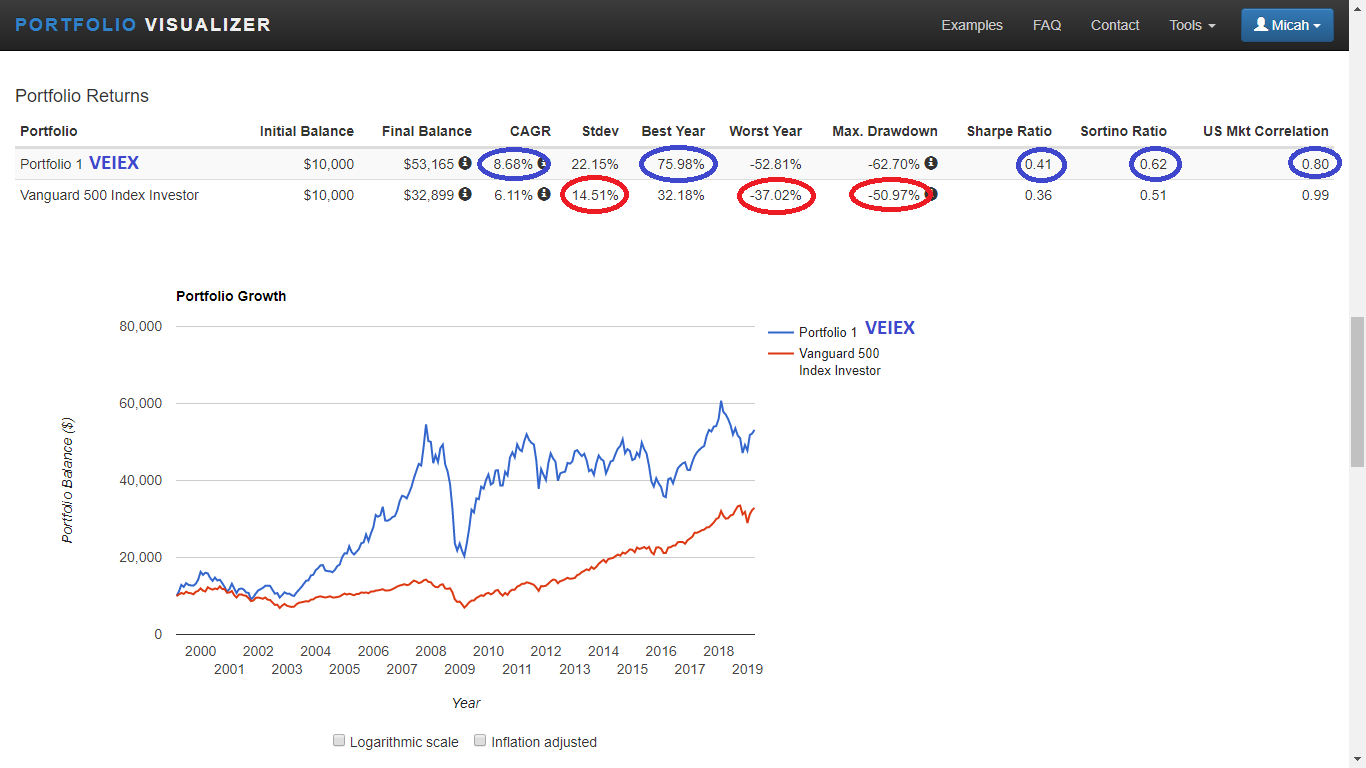
Source: portfoliovisualizer.com
VEIEX vs SPY: April 21, 1999 – April 21, 2019
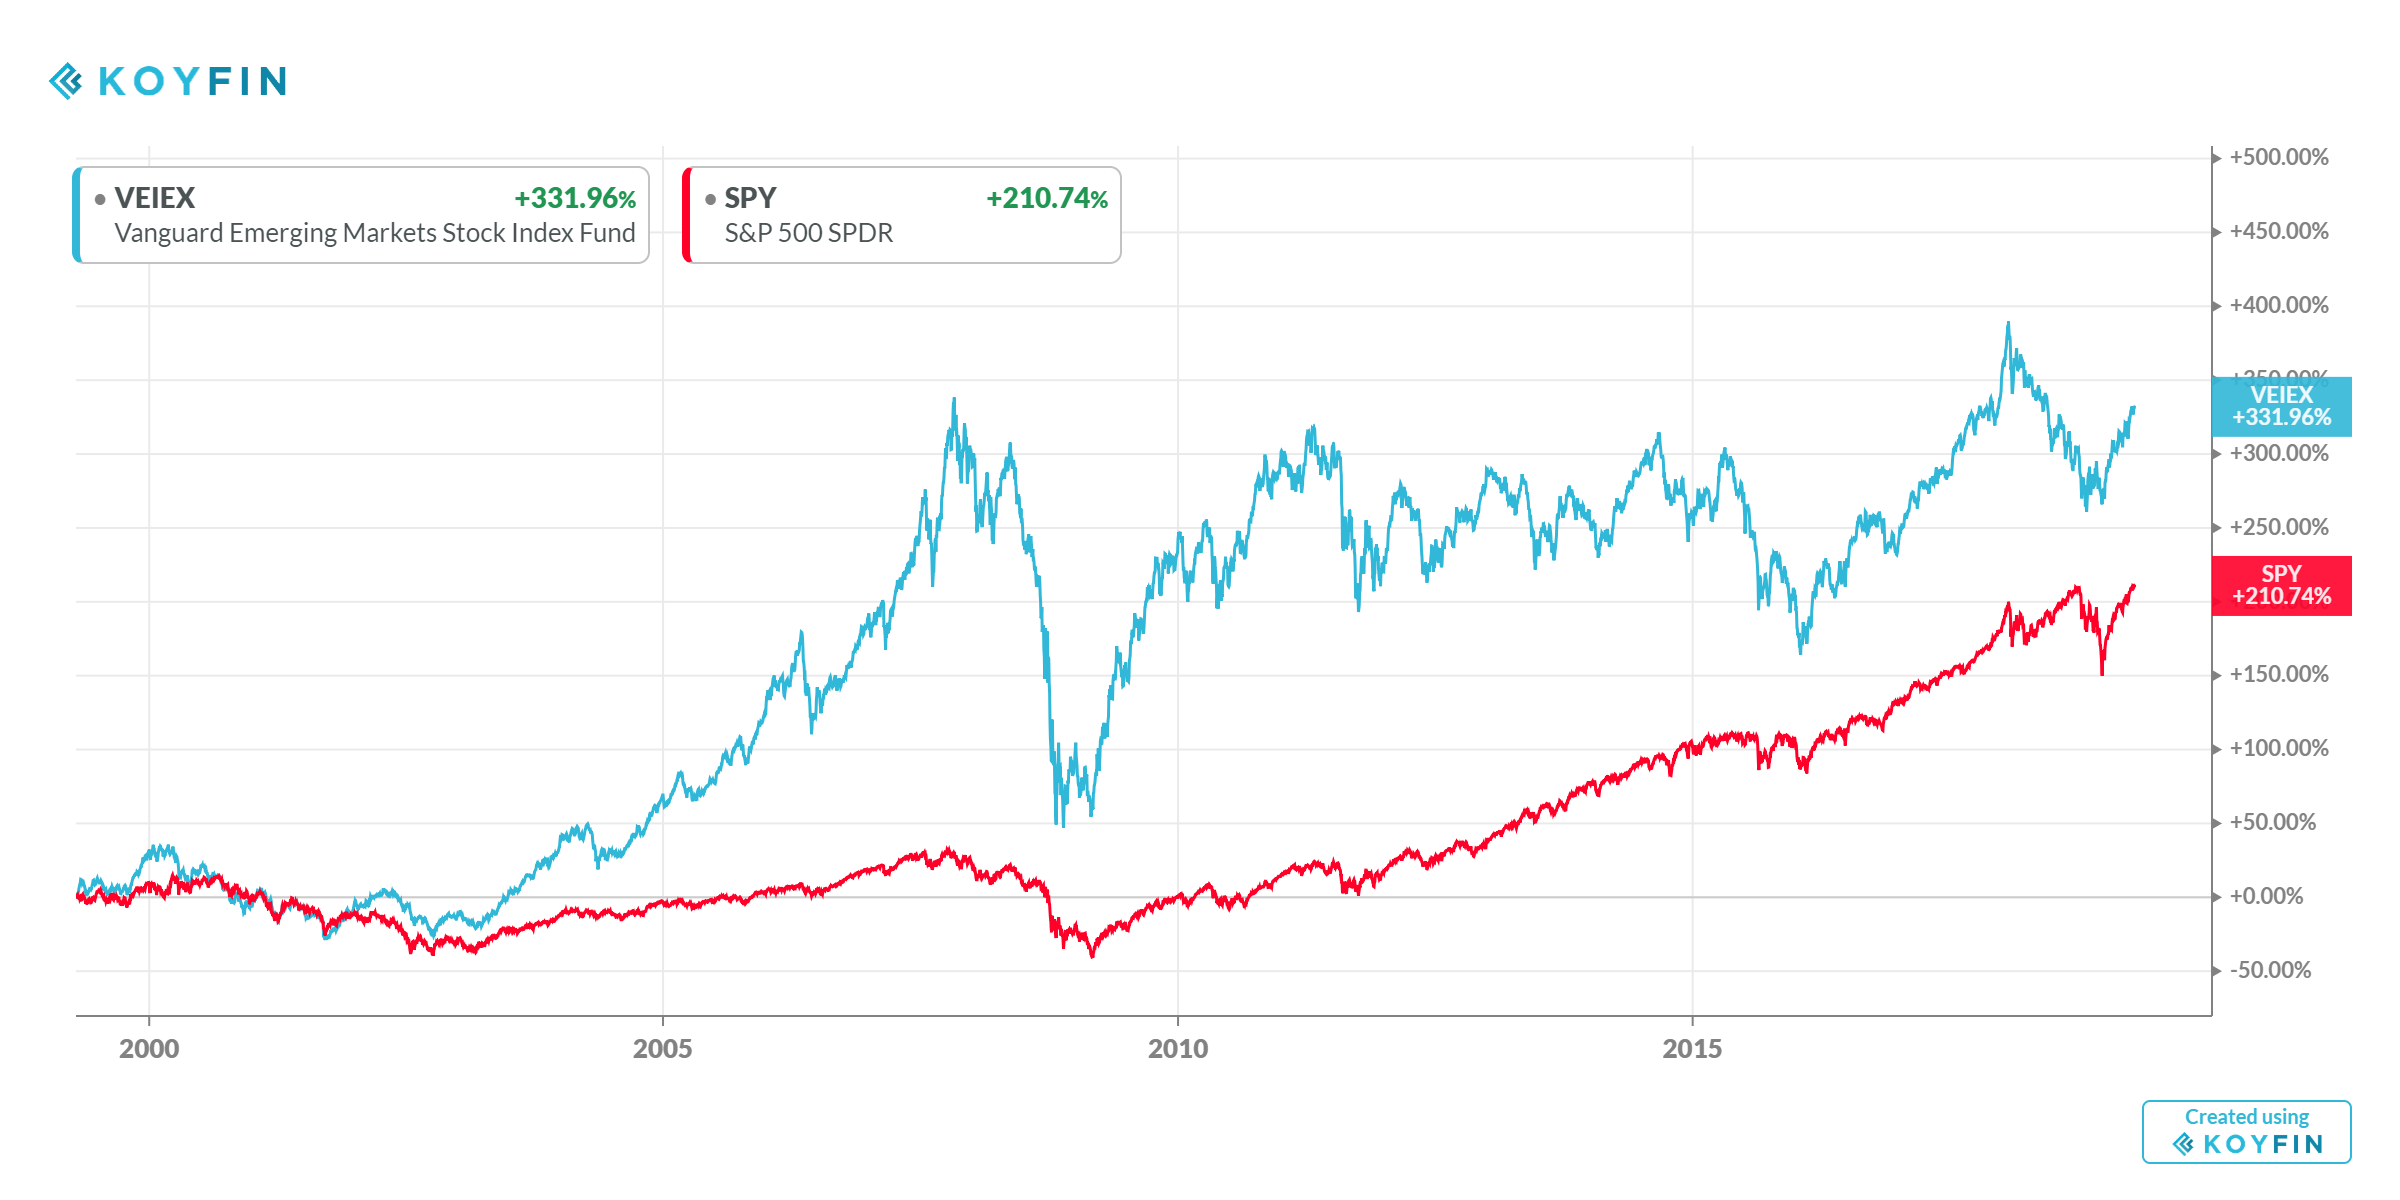
Source: koyfin.com/home
When investors are constructing an equity portfolio, one big consideration should be asset correlation. My favorite place to look at asset correlations is the Novel Investor website. Their asset class returns charts are interactive and give a quick and easy view of how asset performance drastically changes from year to year over 15-year periods. Notice in chart below that Emerging Markets was either the best or 2nd best performing asset class for 7 of the 15 years. On the other hand, Emerging Markets investors also had to endure being at the bottom of this chart 6 of those 15 years. That is volatility! This is why I like to observe charts like this; they are a great representation of how these asset classes have performed in the past and might perform in the future.
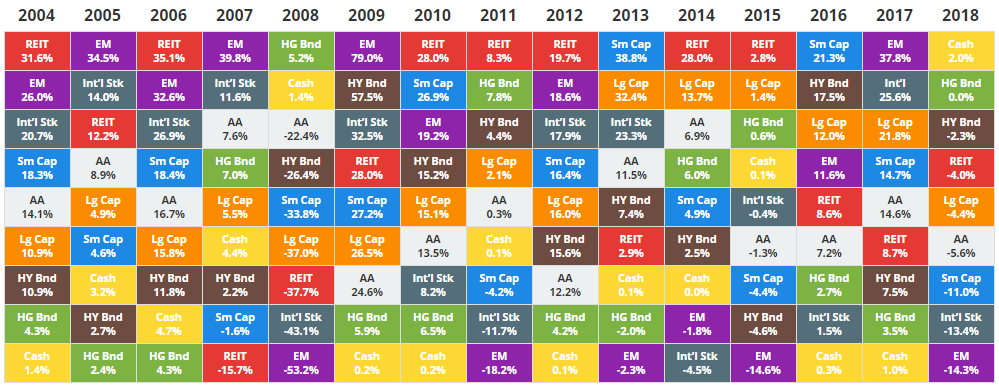
Source: https://novelinvestor.com/asset-class-returns/
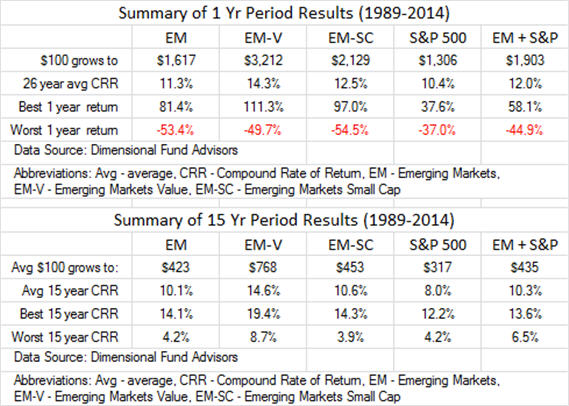
One of my investing mentors, Paul Merriman, has long been an advocate for diversifying equity portfolios with emerging market funds. In his Market Watch article, “Tap into Emerging Profits from Emerging Markets”, Paul demonstrates how adding an emerging market fund to an equity portfolio increased its’ returns and reduced volatility. The chart below, from the article, shows that emerging markets averaged 2.1% outperformance vs an S&P 500 fund for all the 15-year periods from 1989 to 2014.
There are currently 79 ETFs available in the Morningstar category called Diversified Emerging Markets. Twelve of these funds have be available for 10 years or longer. In the chart below, I have ranked all 12 of these older funds by long-term performance. The comparisons were done head-to-head with each fund going back to their dates of inception. The rankings are based solely on long-term performance. No consideration was given to liquidity, quality, valuations or any other metric. Potential investors should perform their own due diligence before investing.
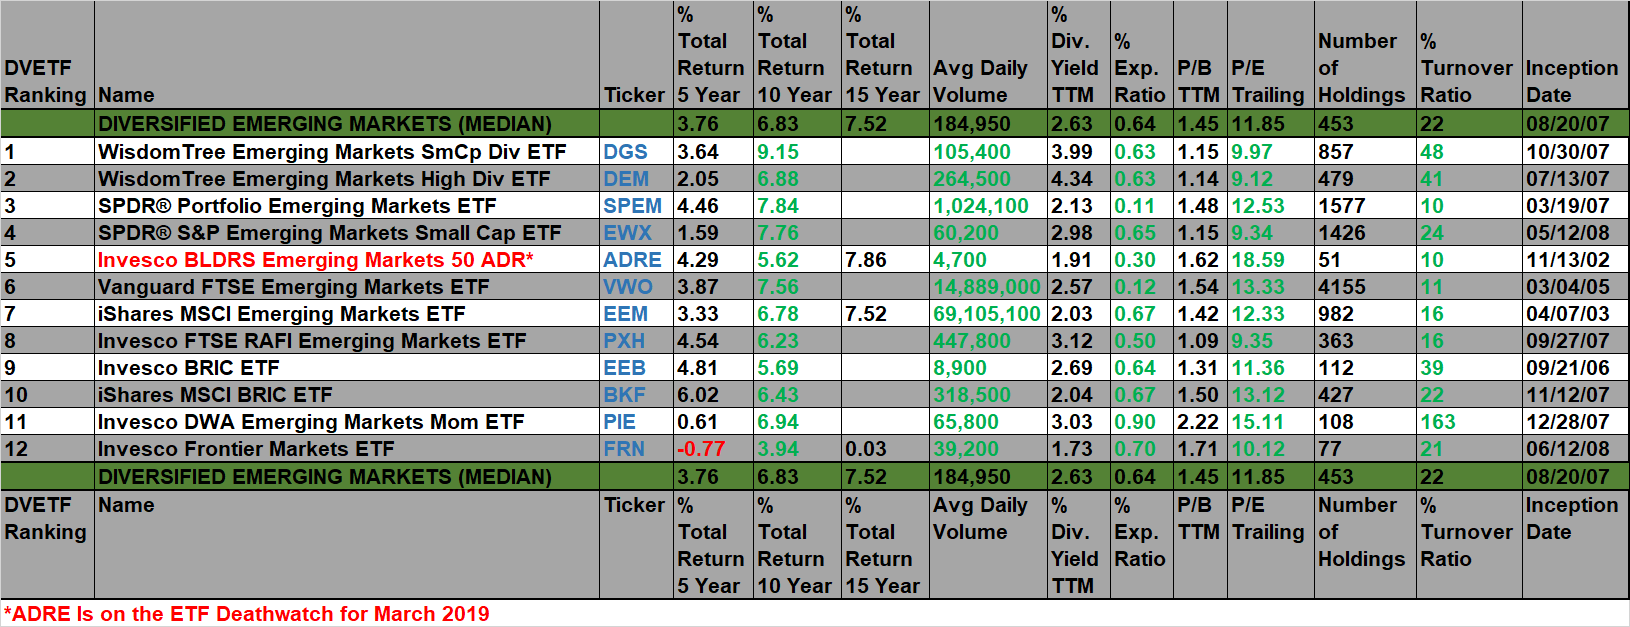
Source: morningstar.com/ and investwithanedge.com/etf-deathwatch-march-2019
The 4 best performing funds were DGS, DEM, SPEM and EWX. The following charts depict how these funds have performed since June of 2008. The reason for that date is because EWX’s inception date was May 12, 2008.
DGS vs DEM vs SPEM vs EWX: April 2008 – March 2019
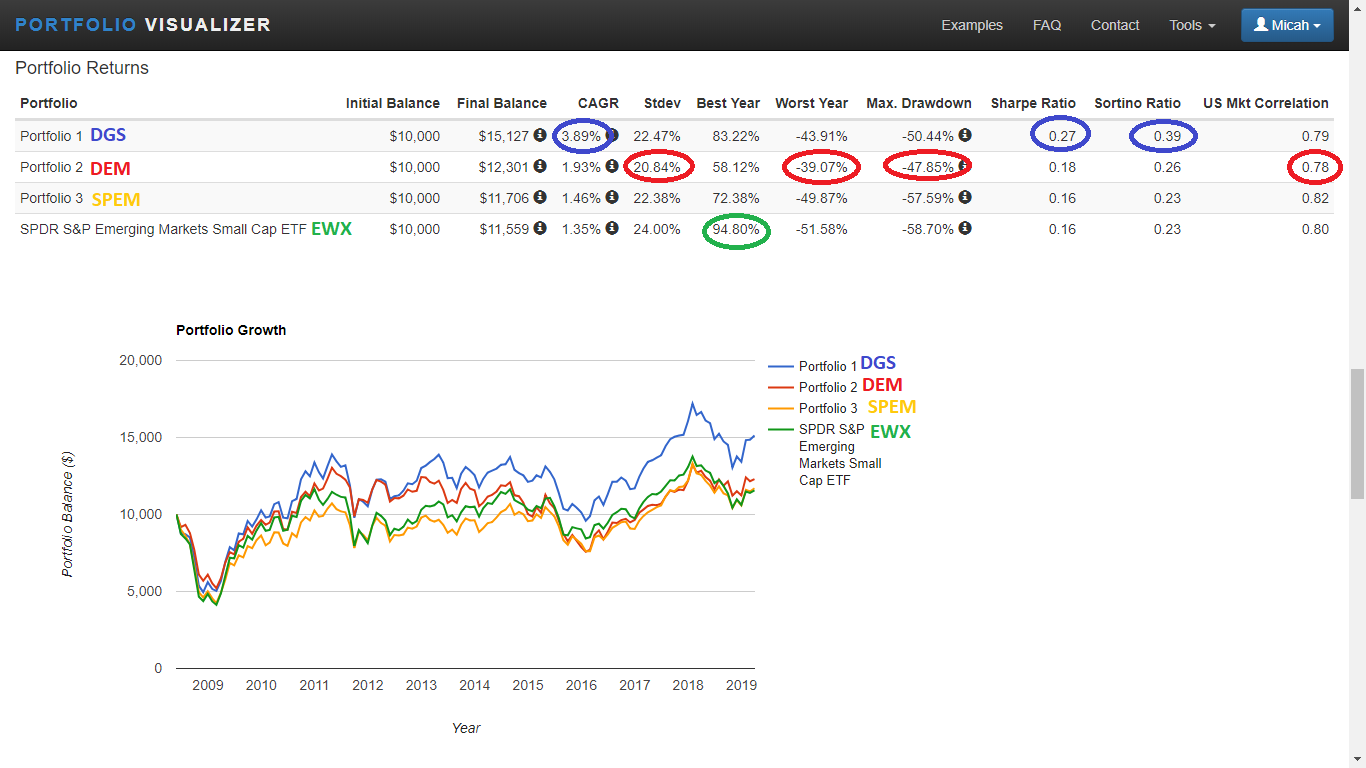
Source: portfoliovisualizer.com/
DGS vs DEM vs SPEM vs EWX: May 16, 2008 – April 21, 2019
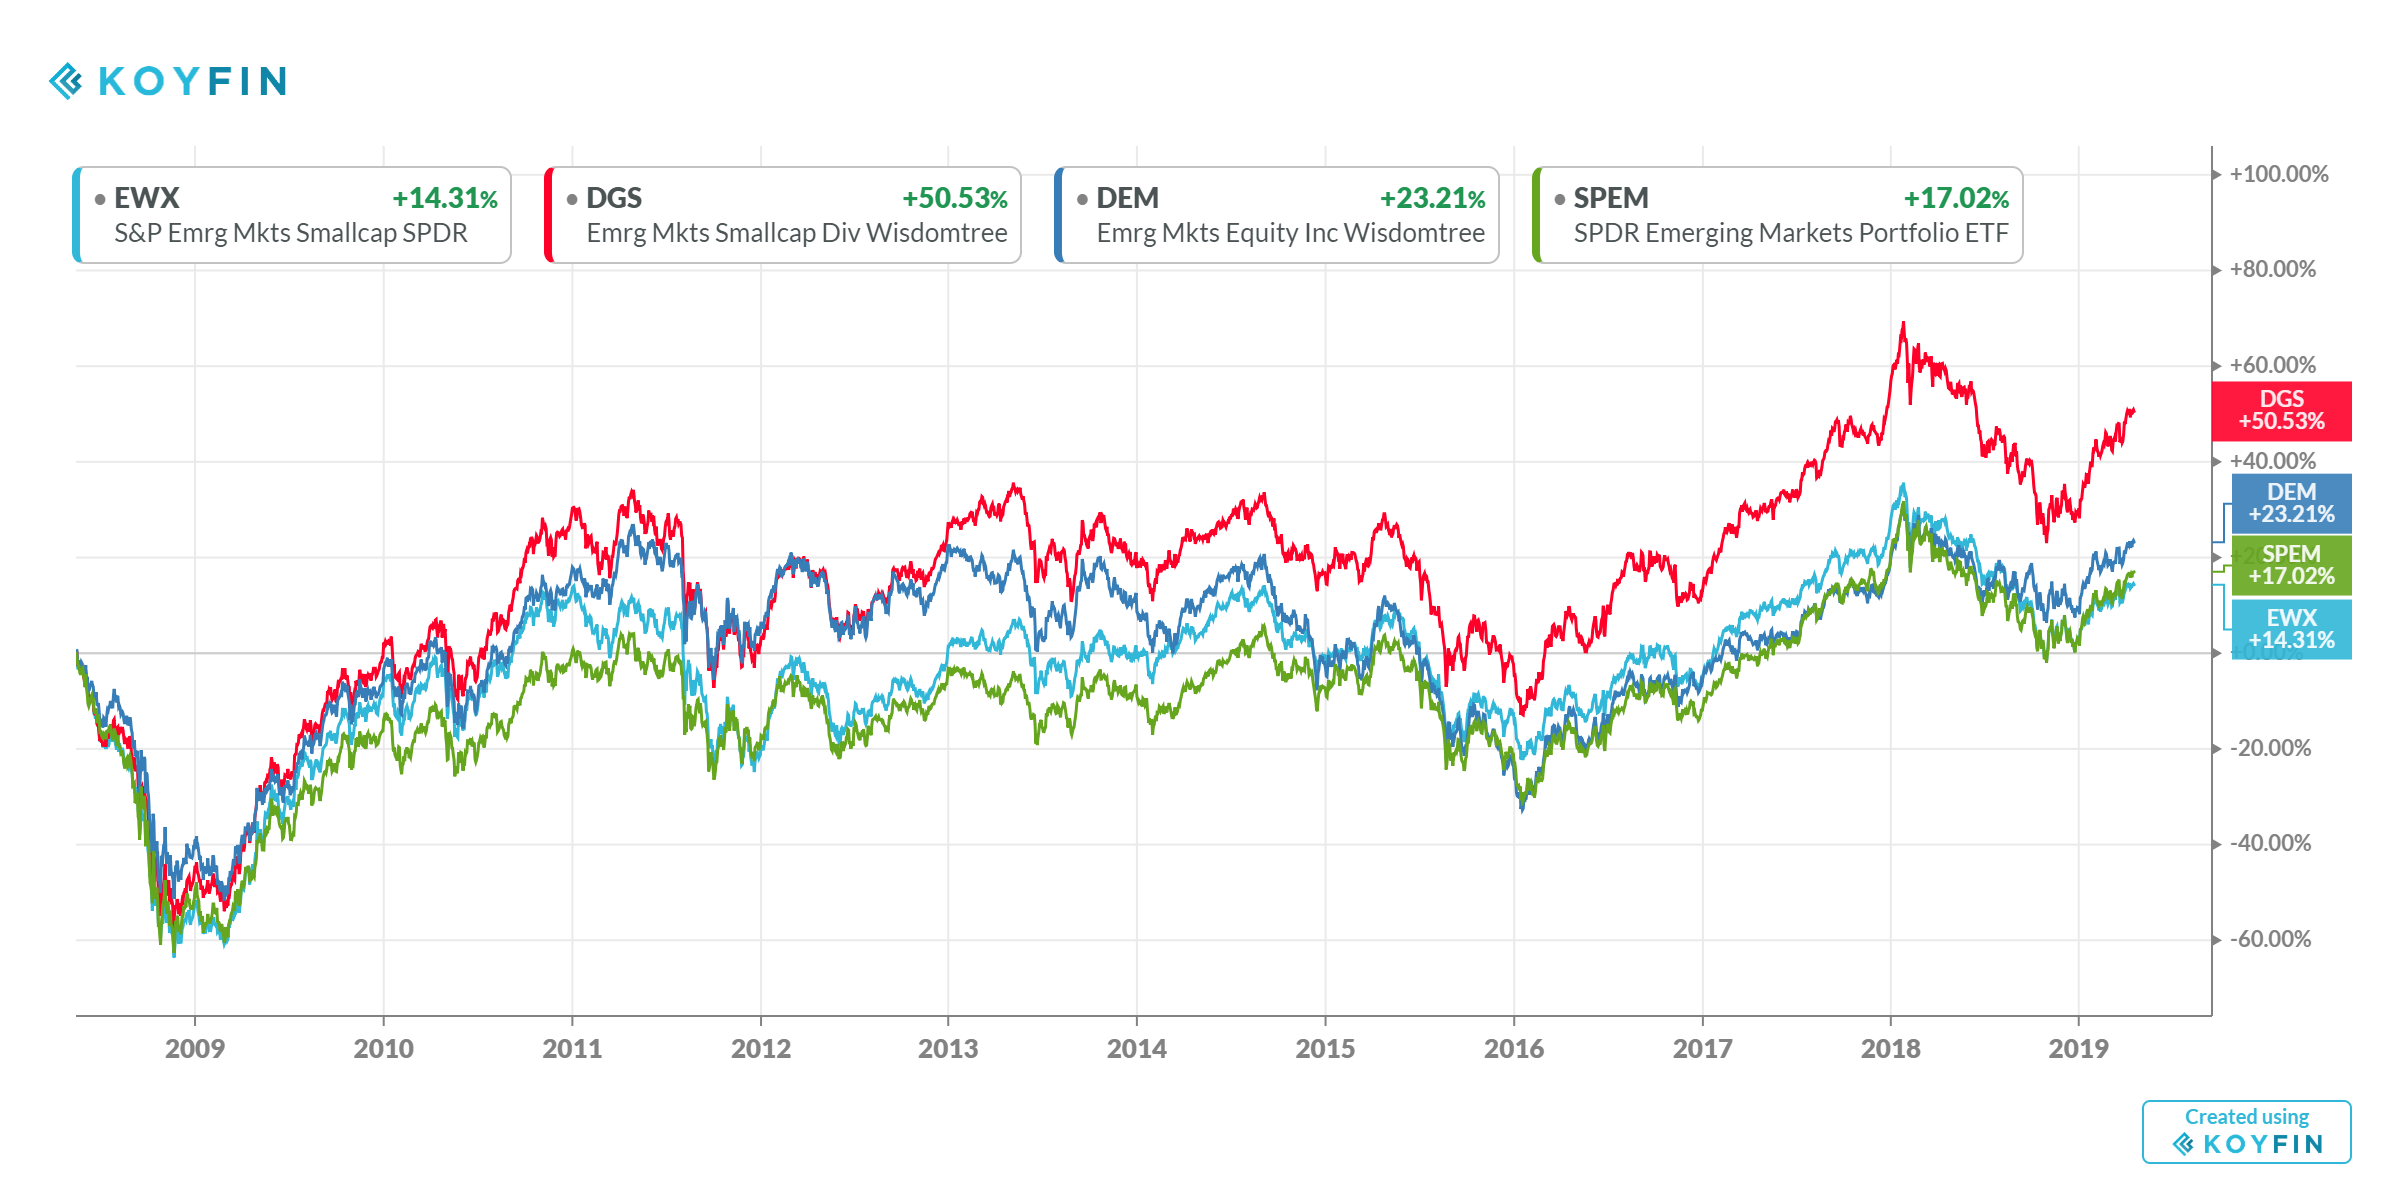
Source: koyfin.com/home
Now that we know the past performance of the 4 best performing Diversified Emerging Markets ETFs, let’s look at each funds’ stated objectives and key features. (My comments added in parentheses.)
DGS – WisdomTree Emerging Markets SmallCap Dividend Fund seeks to track the investment results of dividend-paying small-cap companies in the emerging markets region. Why DGS? Gain exposure to small cap equity of emerging market dividend paying companies. Use to complement emerging market exposure accessing local economic growth and to satisfy demand for growth potential and income focus. (BEST LONG-TERM PERFORMANCE, BEST SHARPE & SORTINO RATIOS)
DEM – WisdomTree Emerging Markets High Dividend Fund seeks to track the investment results of high-dividend-yielding companies in the emerging markets region. Why DEM? Gain exposure to targeted emerging market all cap equity of high dividend yielding companies. Use to diversify income strategies or substitute for emerging market active and passive strategies. Use to satisfy demand for growth potential and income focus. (HIGHEST DIVIDEND, LOWEST P/B & P/E RATIOS, LOWEST VOLATILITY, LOWEST U.S. MARKET CORRELATION)
SPEM – The SPDR® Portfolio Emerging Markets ETF seeks to provide investment results that, before fees and expenses, correspond generally to the total return performance of the S&P® Emerging BMI Index (the "Index"). One of the low-cost core SPDR Portfolio ETFs, a suite of portfolio building blocks designed to provide broad, diversified exposure to core asset classes. A low-cost ETF that seeks to offer broad exposure to emerging market equities. Could potentially mitigate country-specific risk. (BEST 5-YEAR PERFORMANCE, LARGEST BY AUM, LOWEST EXPENSE RATIO, MOST DIVERSIFIED, LOWEST TURN-OVER RATIO)
EWX – The SPDR® S&P® Emerging Markets Small Cap ETF seeks to provide investment results that, before fees and expenses, correspond generally to the total return performance of the S&P® Emerging Markets Under USD2 Billion Index (the "Index"). Seeks to provide exposure to the small capitalization segment of emerging countries included in the S&P Global Broad Market Index. The selection universe includes all emerging country equites within the S&P Global BMI with market capitalizations between $100 million and $2 billion at the time of inclusion. (BEST SINGLE-YEAR PERFORMANCE)
The Diversified Emerging Markets asset class can be an excellent way to diversify an equity portfolio without diluting returns. Due to the high volatility of this asset class, short-term investors will probably be disappointed, but long-term investors should expect an equity risk premium for taking on such volatility. Emerging Markets have a long track record of good returns over long periods (longer than 10 years). Recent history reminds us that this asset class can drastically underperform other markets during shorter timeframes (less than 10 years). Fortunately, ETF providers have given us many low-cost ways to participate in Emerging Market equities with 79 different ETFs. Investors searching for ETFs with long-term track records have at least 12 funds to pick from. The top 4 ETFs in this category are worth considering for diversifying a long-term equity portfolio.
Thank you for taking time to read this article. If you found it useful, please share it with a friend.
Disclosures: We currently own shares of DGS & DEM, and we intend to purchase more shares in the future. I am not a professional investment advisor. Please perform you own due diligence or seek ...
more


Impressive.
Thank you Alpha. I appreciate that very much. This is my first article for TalkMarkets. Micah.
Welcome, looking forward to reading more by you - I've added you to my follow list.
Thank you.