Bank Bloodbath Brings Down 'Bull Market' As Yield Curve Crashes
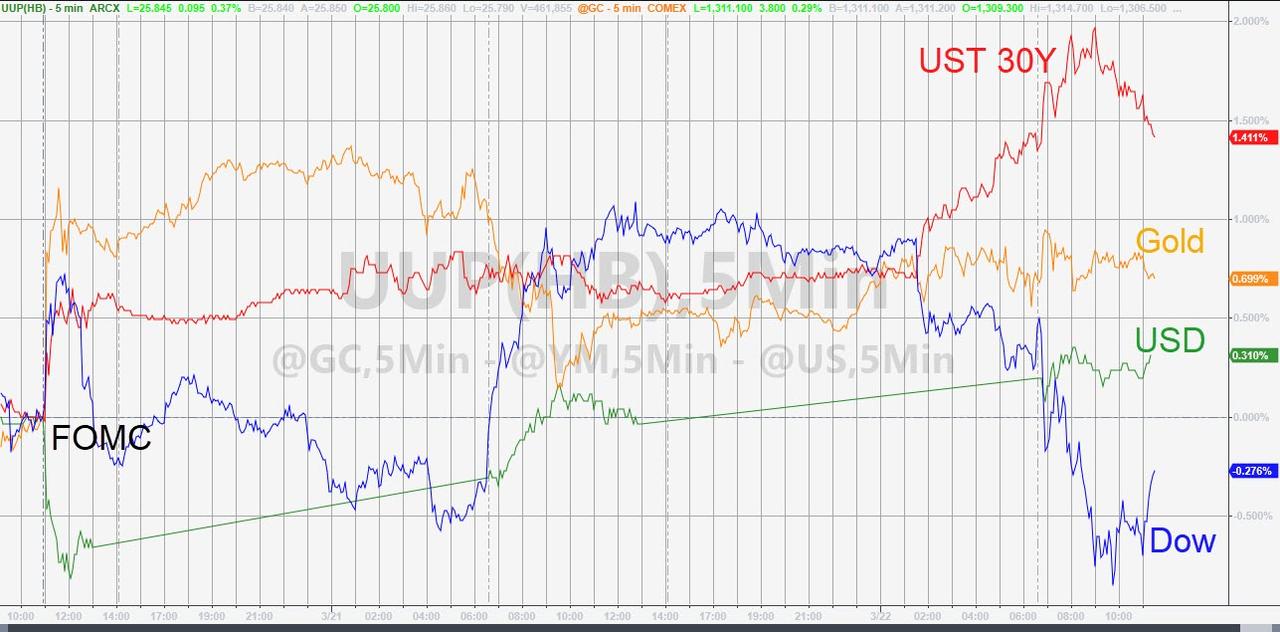
Bonds, Bullion, & The Greenback are all higher since The Fed threw in the towel... stocks are lower...
(Click on image to enlarge)
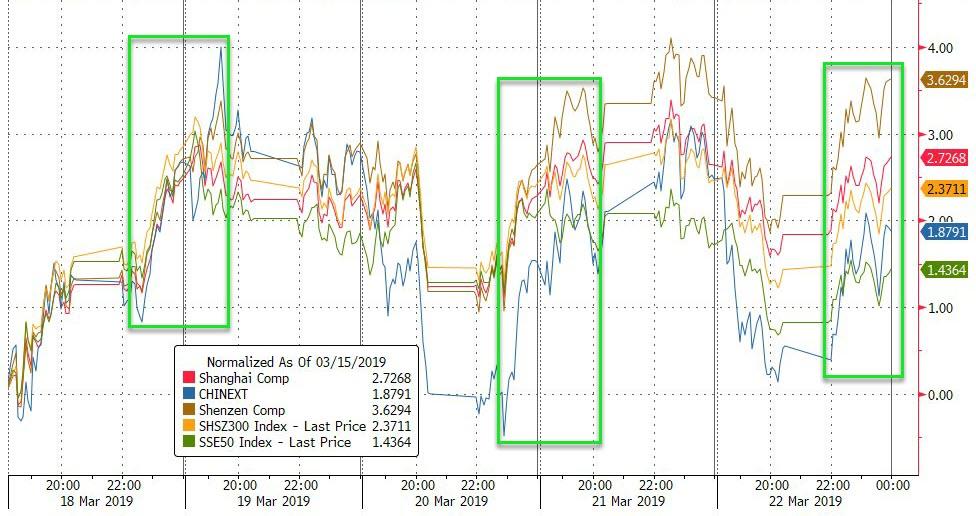
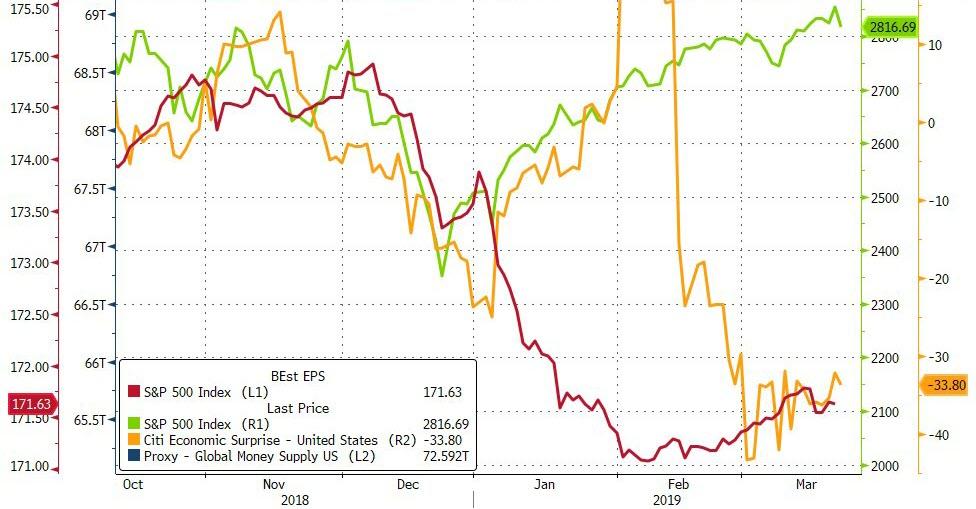
And despite the desperate efforts to talk up the economy, SHTF today...
Chinese stocks managed gains on the week, thanks to three big liftathons...
(Click on image to enlarge)
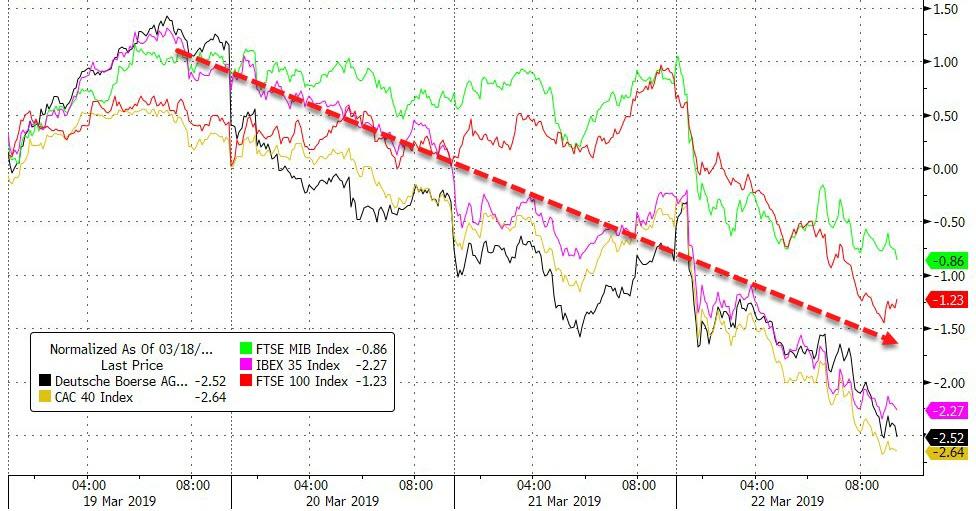
European markets were ugly all week...
(Click on image to enlarge)
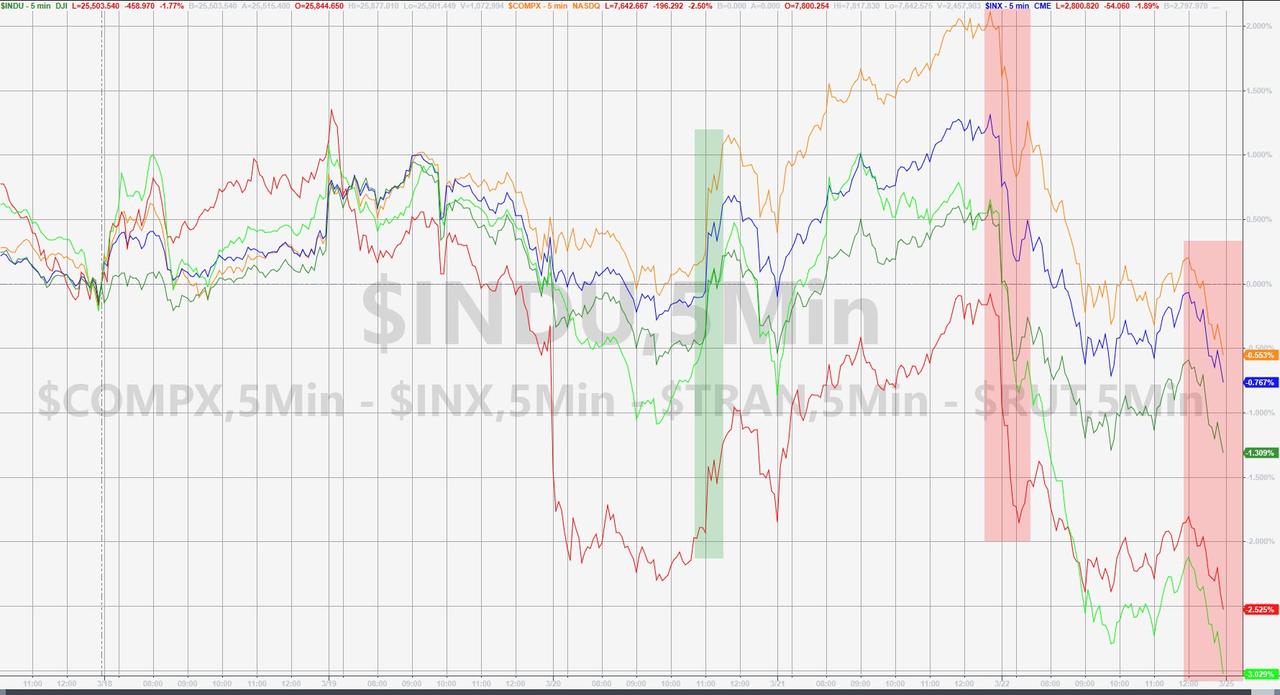
US equity markets had their worst day since Jan 3rd - all ending the week lower...
(Click on image to enlarge)
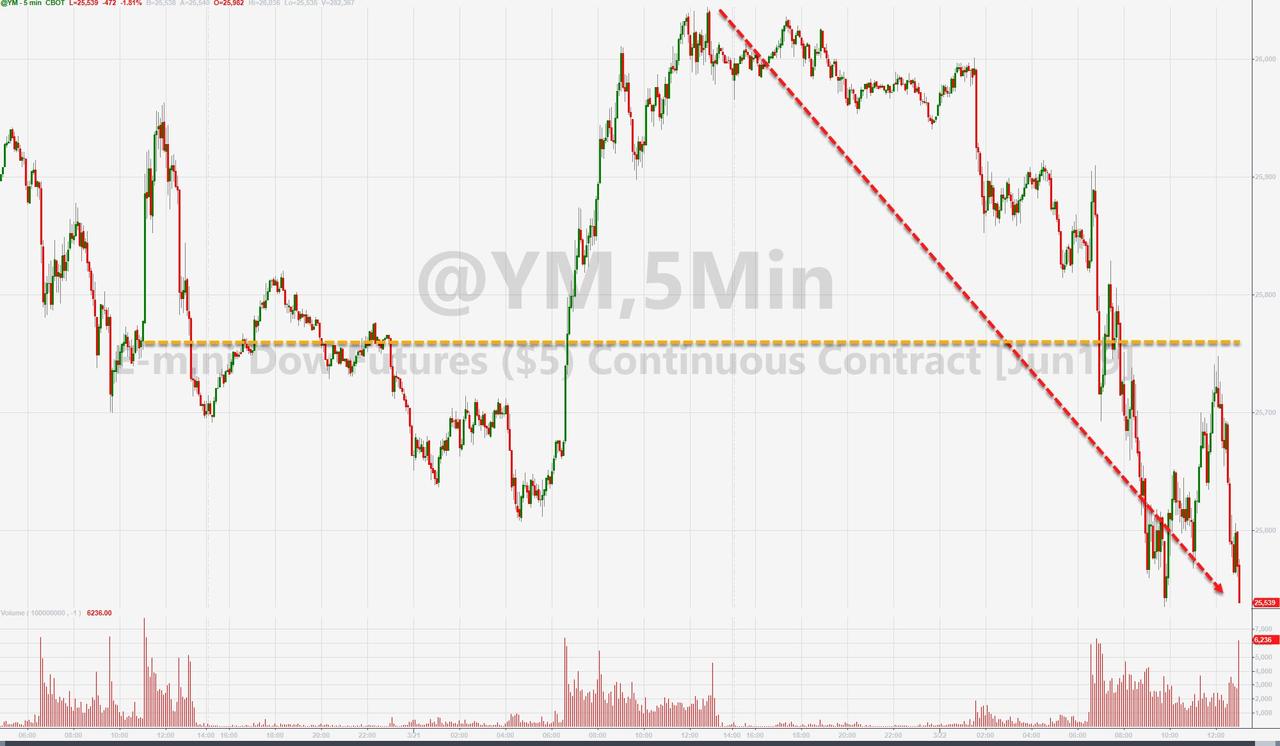
Dow futures fell 500 points from the overnight highs...
(Click on image to enlarge)
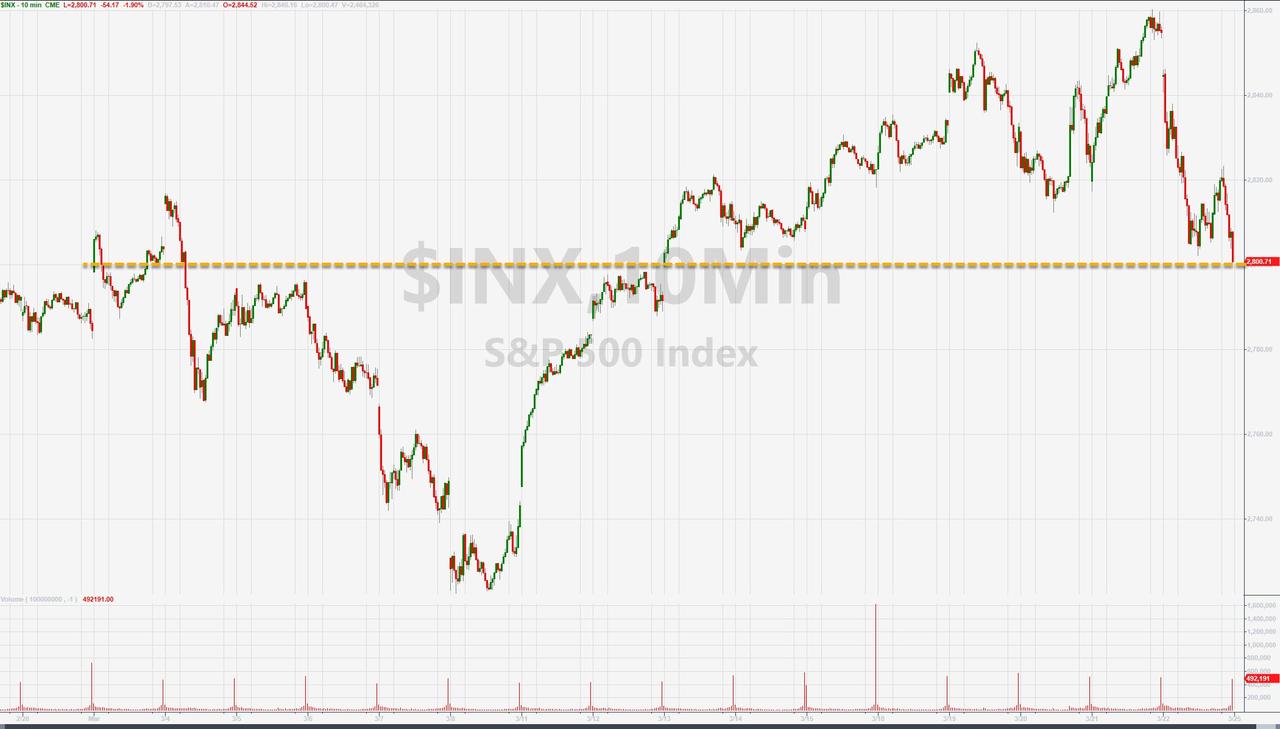
And the S&P 500 fell all the way to stop dead on 2800...
(Click on image to enlarge)
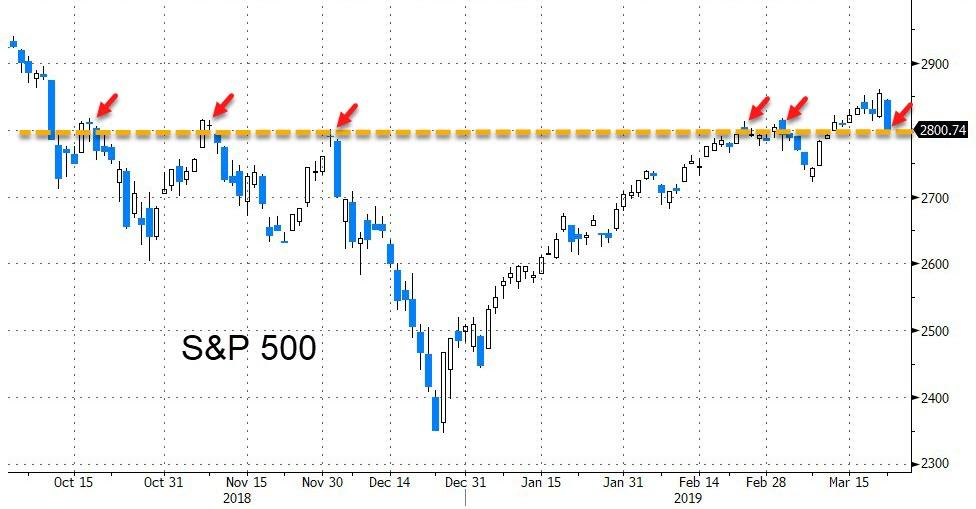
Marking the sixth refusal at that magical level...
(Click on image to enlarge)
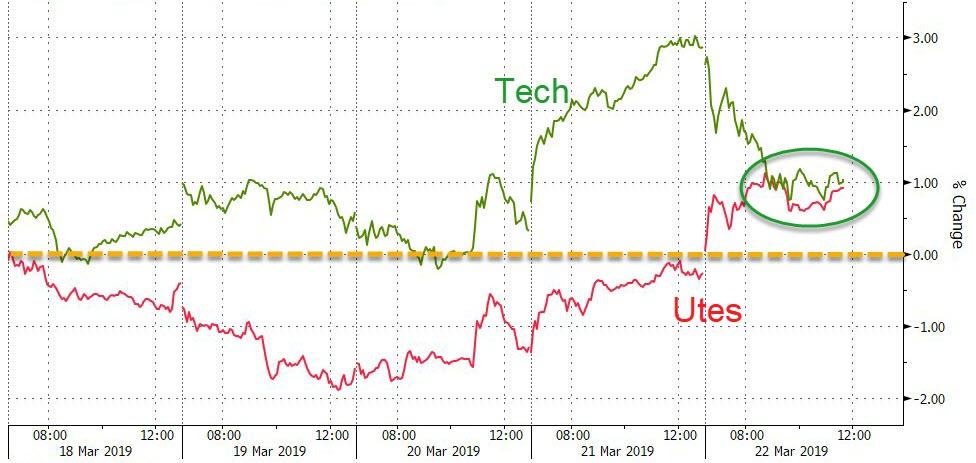
As Bloomberg noted, you know things have gone a bit pear-shaped when utilities and tech are the top gainers, comfortably outperforming the broader market. But they took quite divergent paths to get there.
(Click on image to enlarge)
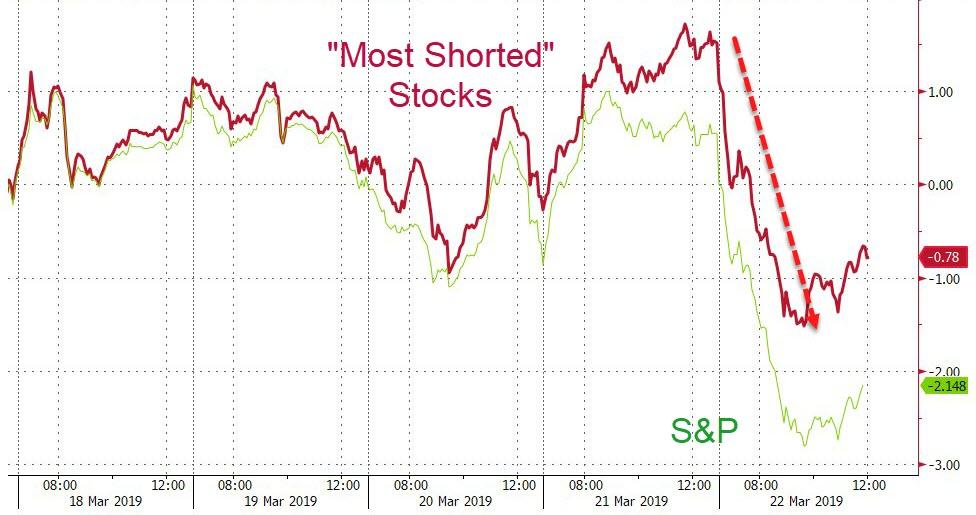
It appears the squeezers ran out of ammo...
(Click on image to enlarge)
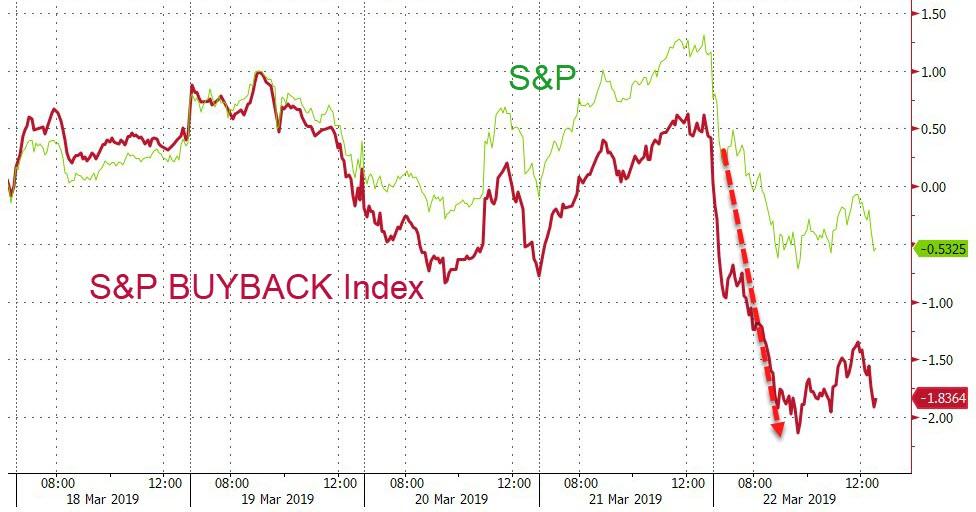
Buybacks had a good week - until Friday, as the blackout window looms...
(Click on image to enlarge)
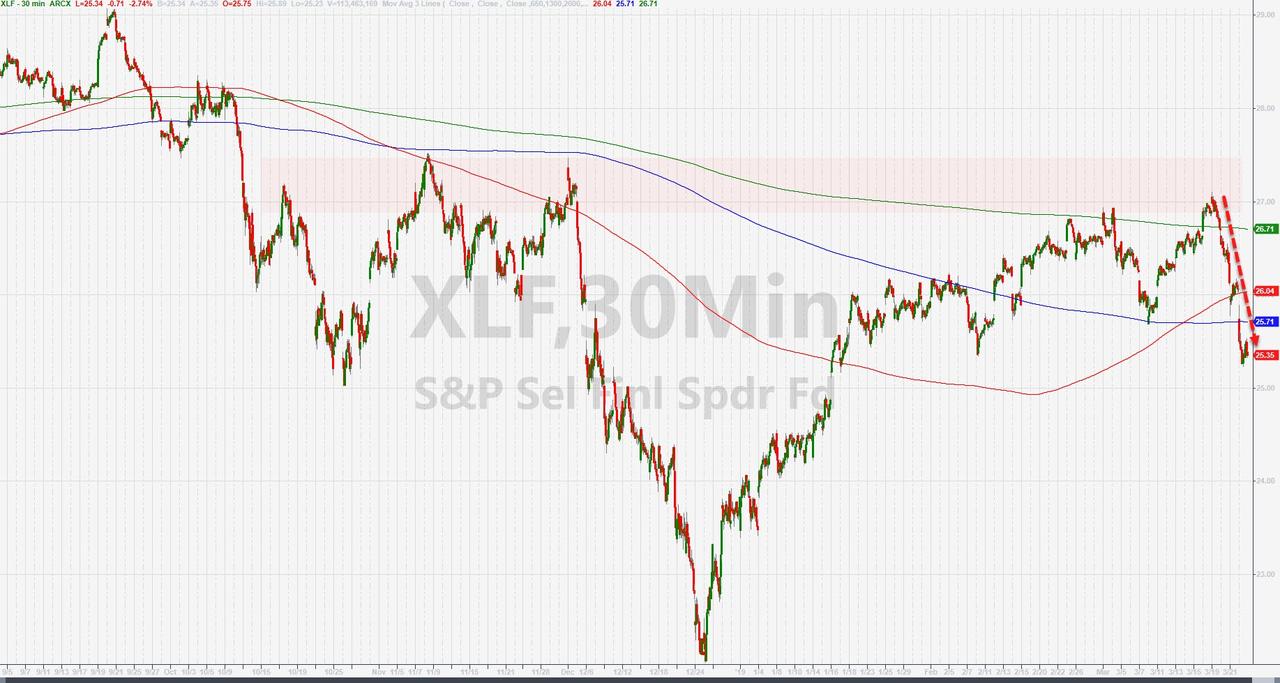
Big bank stocks have bloodbath'd this week (worst week of the year) as the hopes of higher rates and steeper curve evaporate...
(Click on image to enlarge)
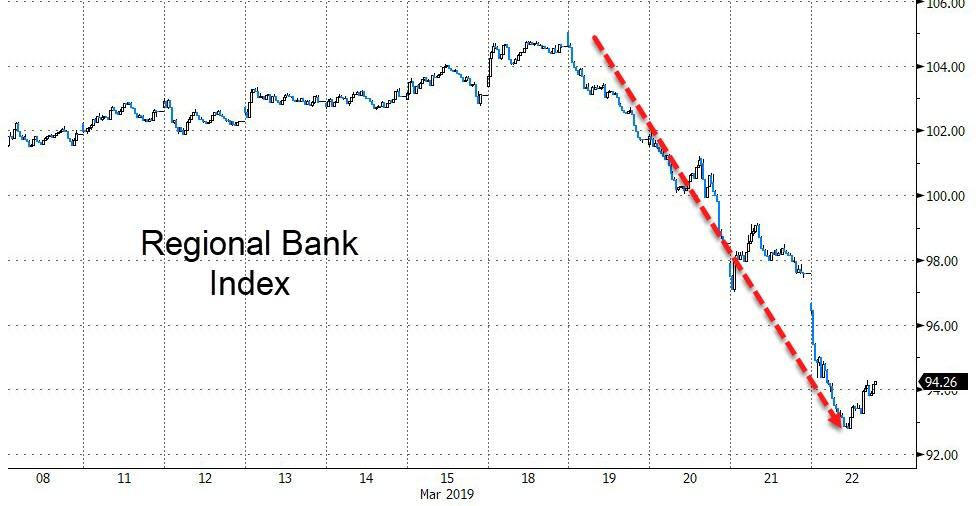
But Regional banks were clubbed like a baby seal... the biggest weekly drop since Sept 2011 - after the USA downgrade
(Click on image to enlarge)
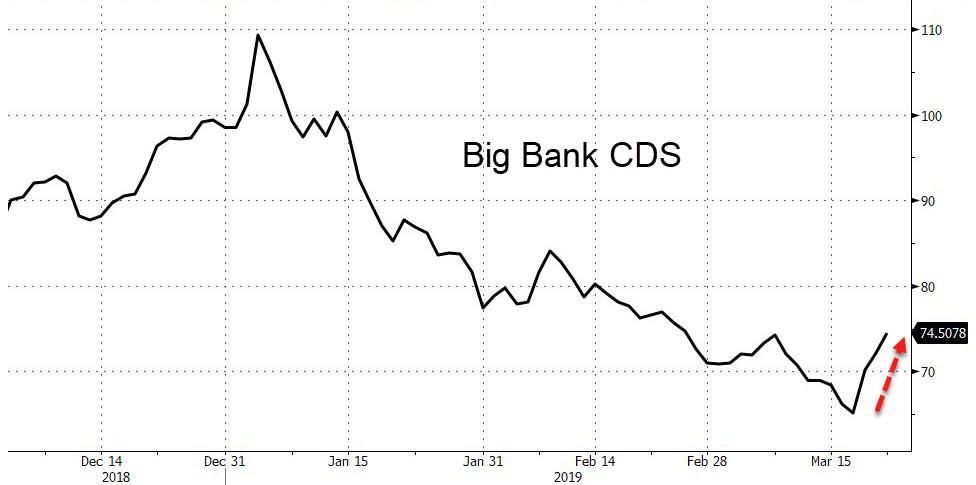
And bank CDS have started to creep higher...
(Click on image to enlarge)
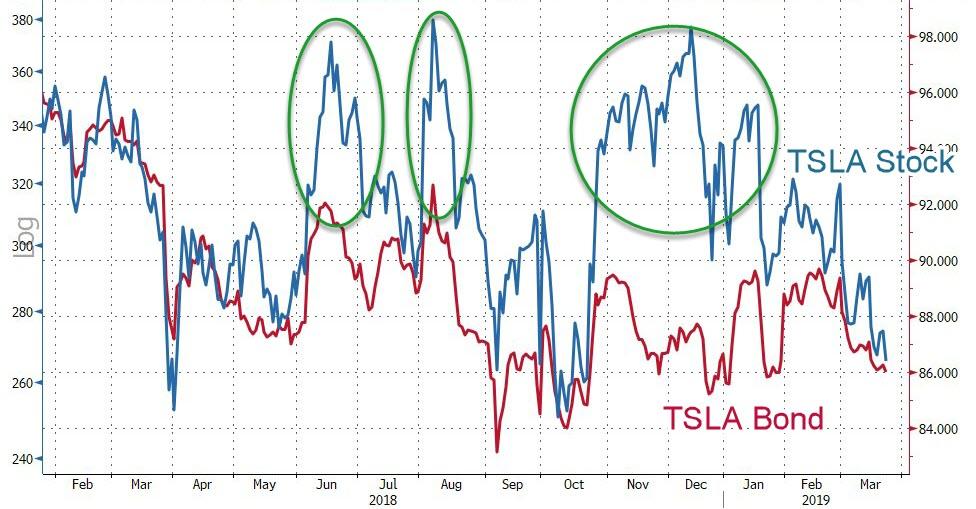
Tesla had an ugly week...
(Click on image to enlarge)
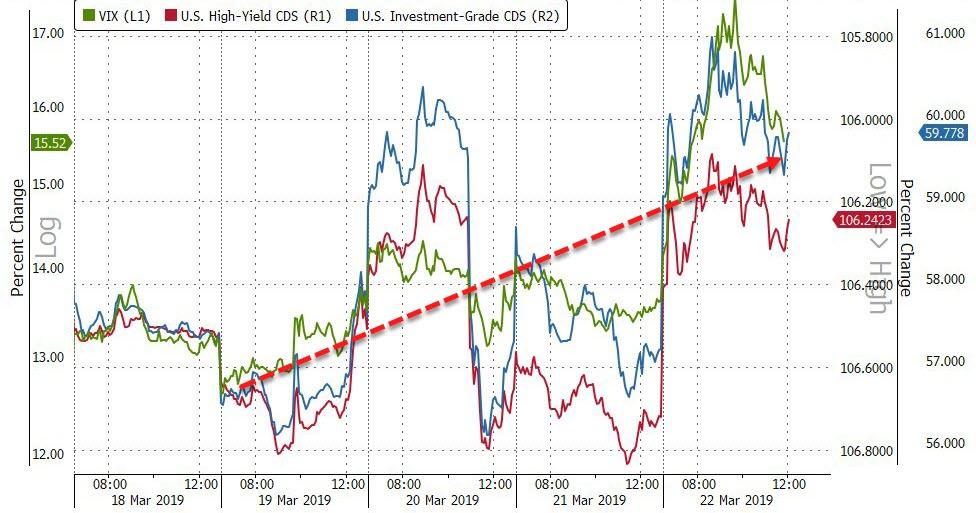
Credit and equity protection costs surged on the week...
(Click on image to enlarge)
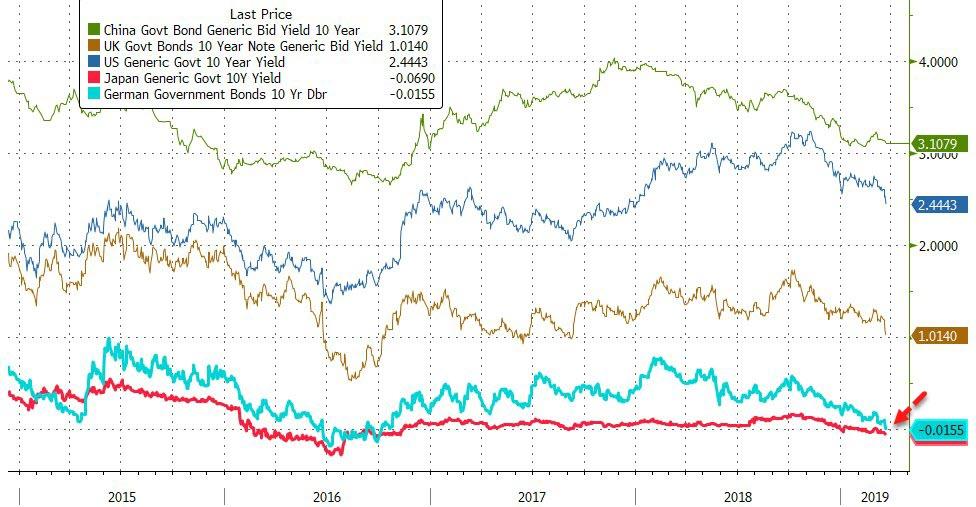
Yields collapsed around the world this week, with 10Y bunds going negative once again...
(Click on image to enlarge)
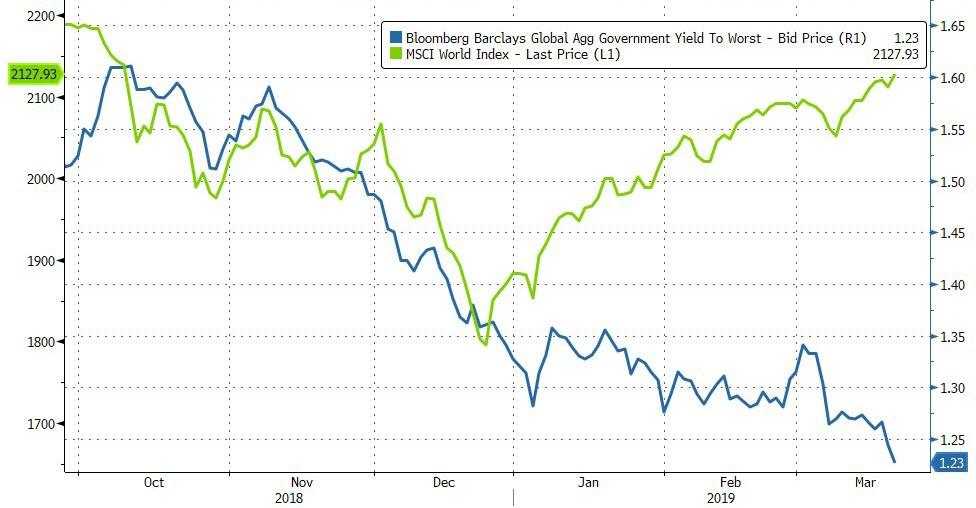
Global average sovereign yields plunged to lowest since April 2018...
(Click on image to enlarge)
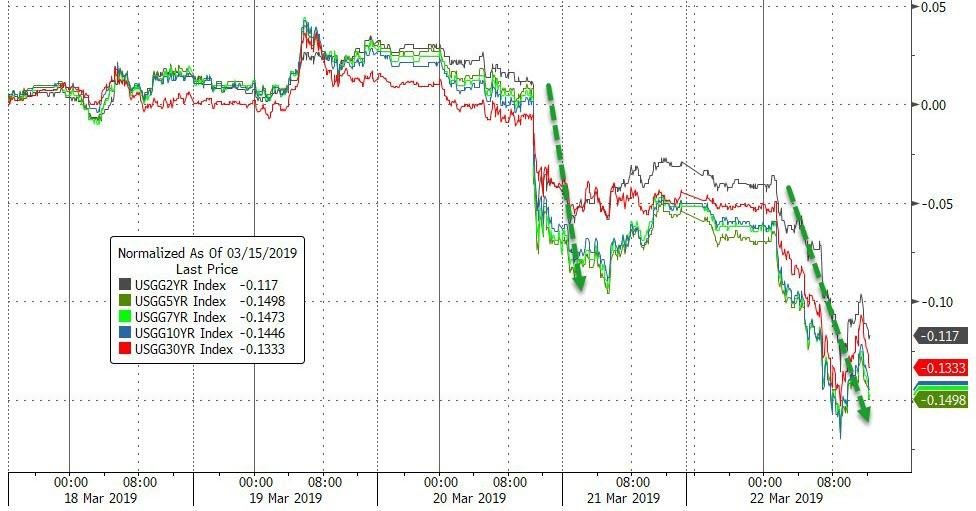
US Treasury yields crashed this week... this is the biggest weekly drop in 5Y, 7Y, and 10Y yields since April 2017
(Click on image to enlarge)
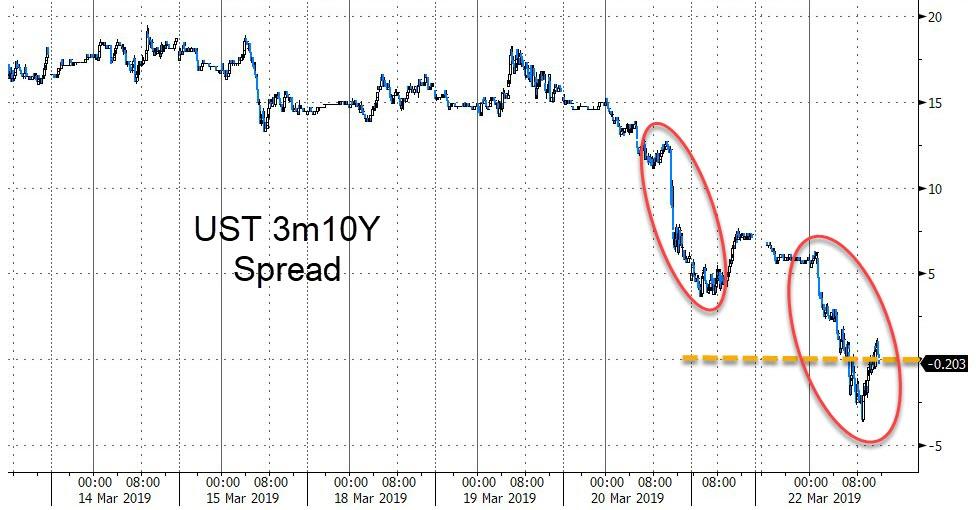
For the first time since 2007, the spreads between 3m and 10y yields inverted - flashing the most-effective recession indicator since WW2...
(Click on image to enlarge)
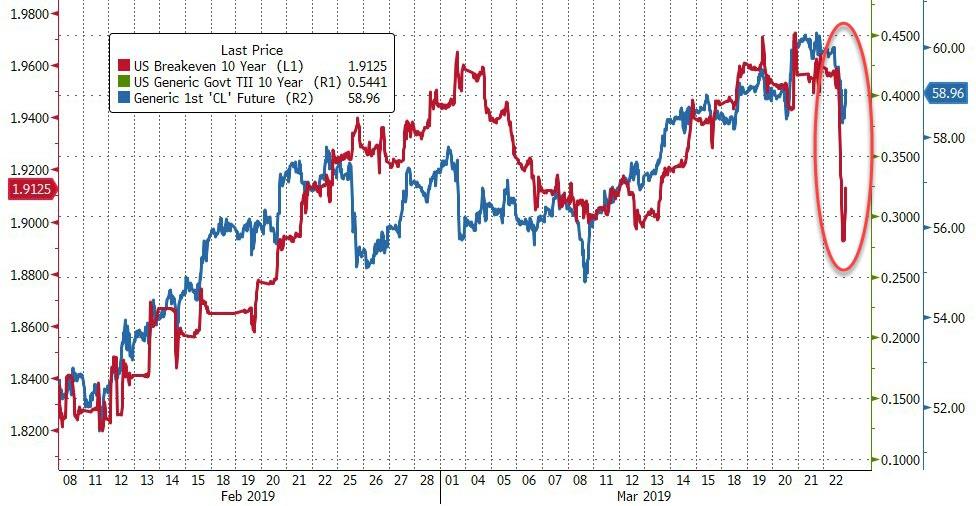
And inflation breakevens plunged, despite a lack of oil confirmation...
(Click on image to enlarge)
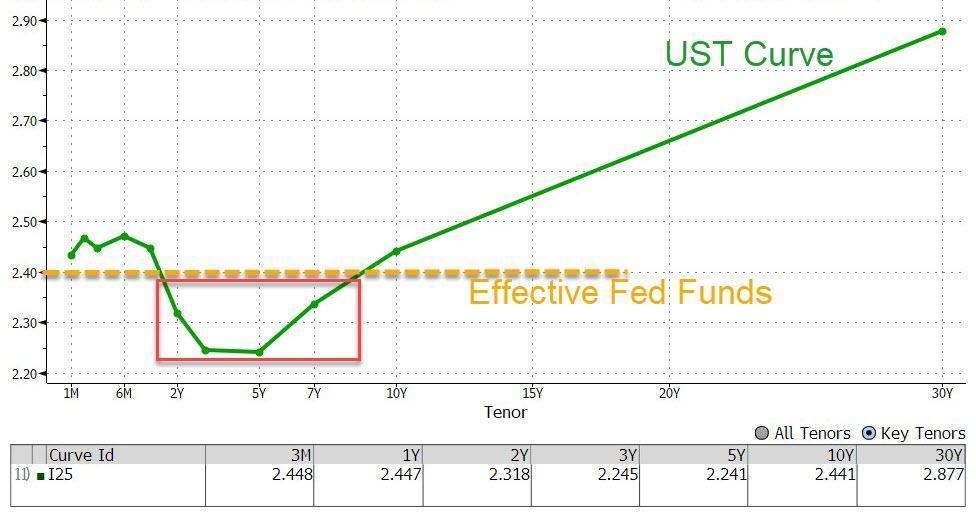
The yield curve is now inverted to Fed Funds out to almost 10Y...
(Click on image to enlarge)
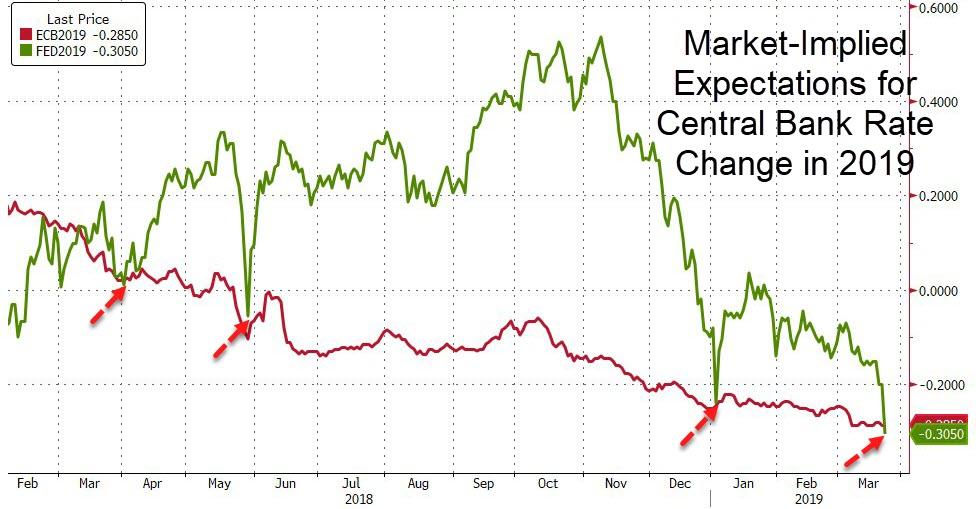
Notably, The Fed is now priced to be easier than The ECB in 2019...
(Click on image to enlarge)
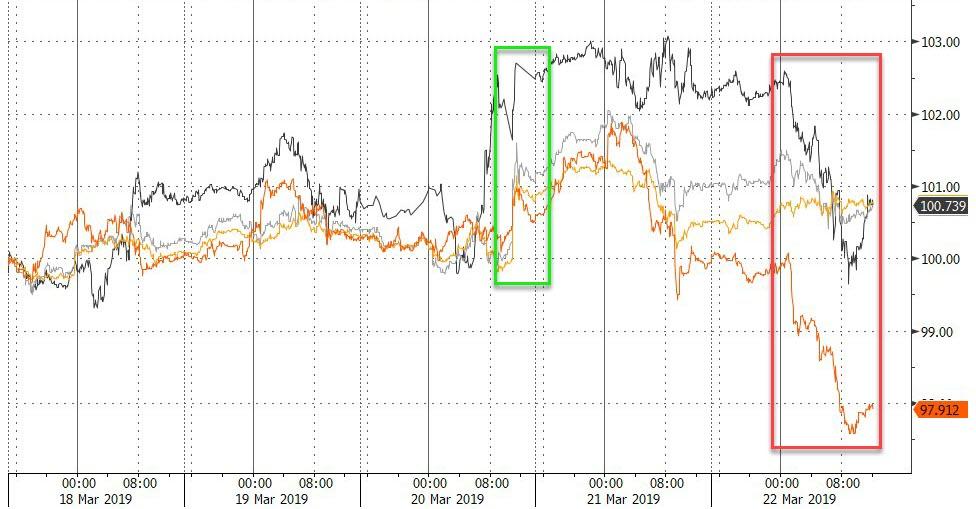
The dollar index ended the week very marginally higher thanks to serious buying-panic in the last two days since The Fed...
(Click on image to enlarge)
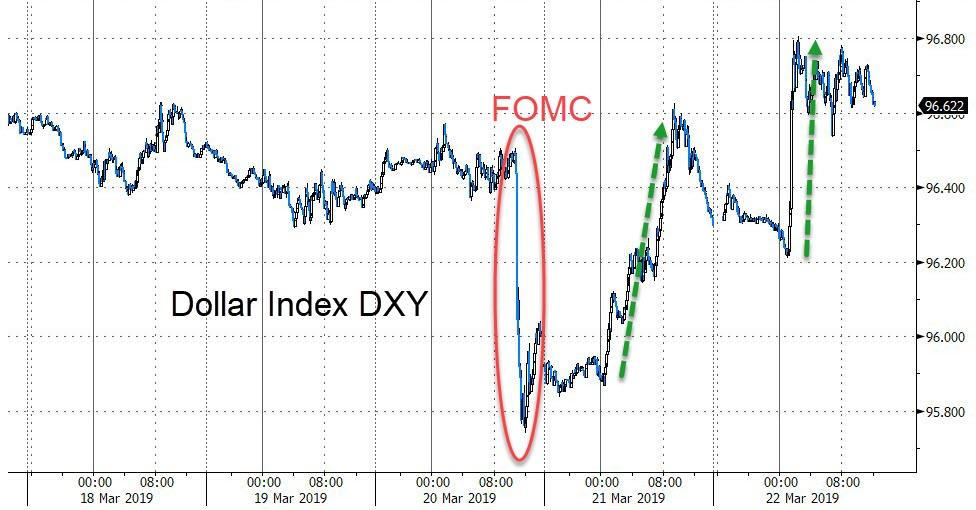
The relative stability expected from an easing Fed has prompted a run into carry trades and USD remains a big player.
The Turkish Lira collapsed today as a surprise tightening by the Turkish central bank failed to stem a rout in the wake of an unexplained drop in official reserves.
(Click on image to enlarge)
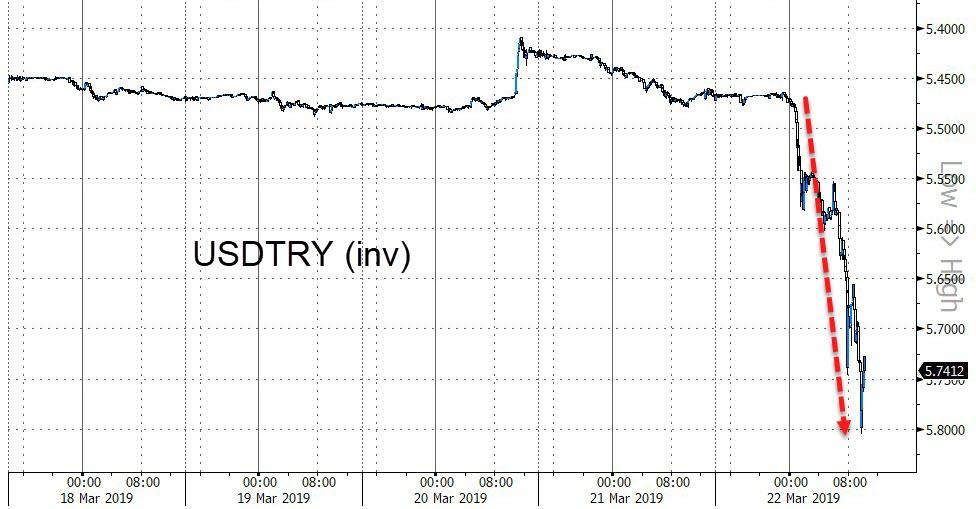
“Today the unsustainable nature of state-owned banks being the only sellers of [US dollars in exchange for lira] over recent weeks became evident,” said Roger Hallam, chief investment officer for currencies at JPMorgan Asset Management.
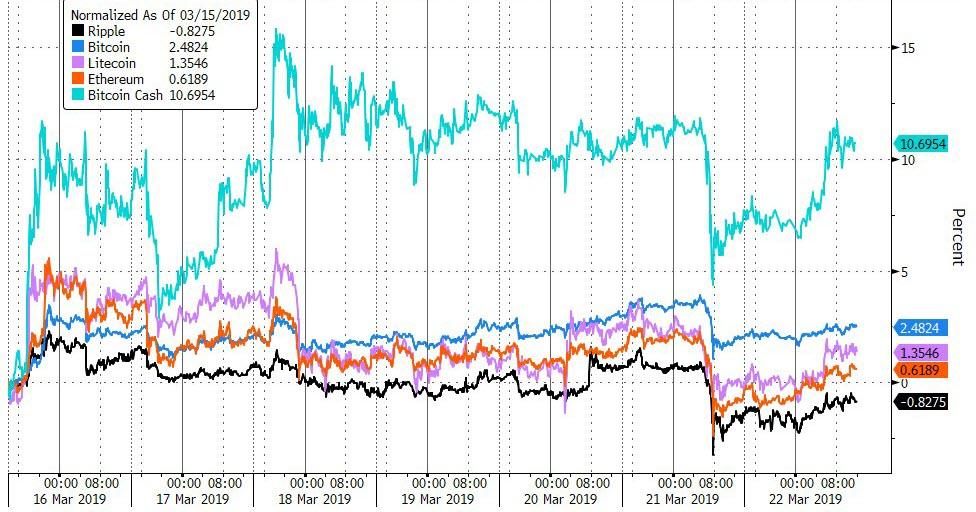
Bitcoin managed gains on the week but Bitcoin Cash outperformed...
(Click on image to enlarge)
Copper ended the week lower as China growth questions continued but WTI and PMs managed to hold on to gains despite the dollar ending higher...
(Click on image to enlarge)
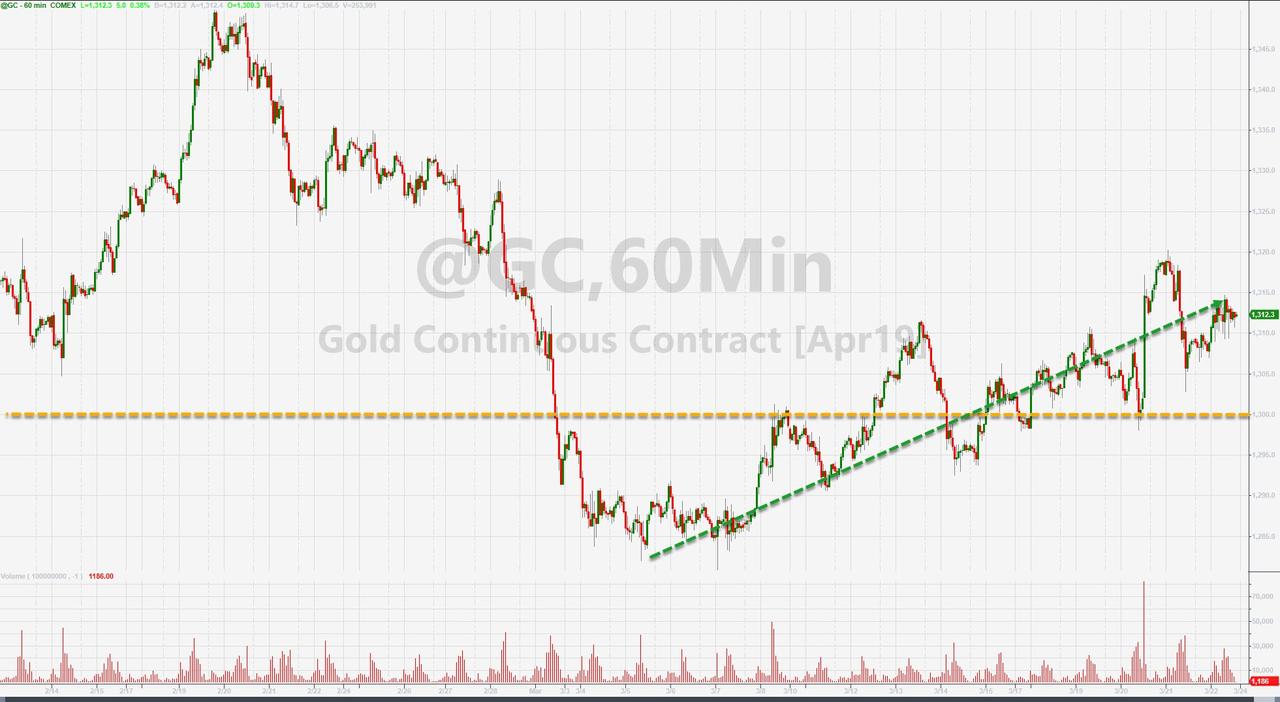
Gold rallied for the 3rd week in a row...
(Click on image to enlarge)
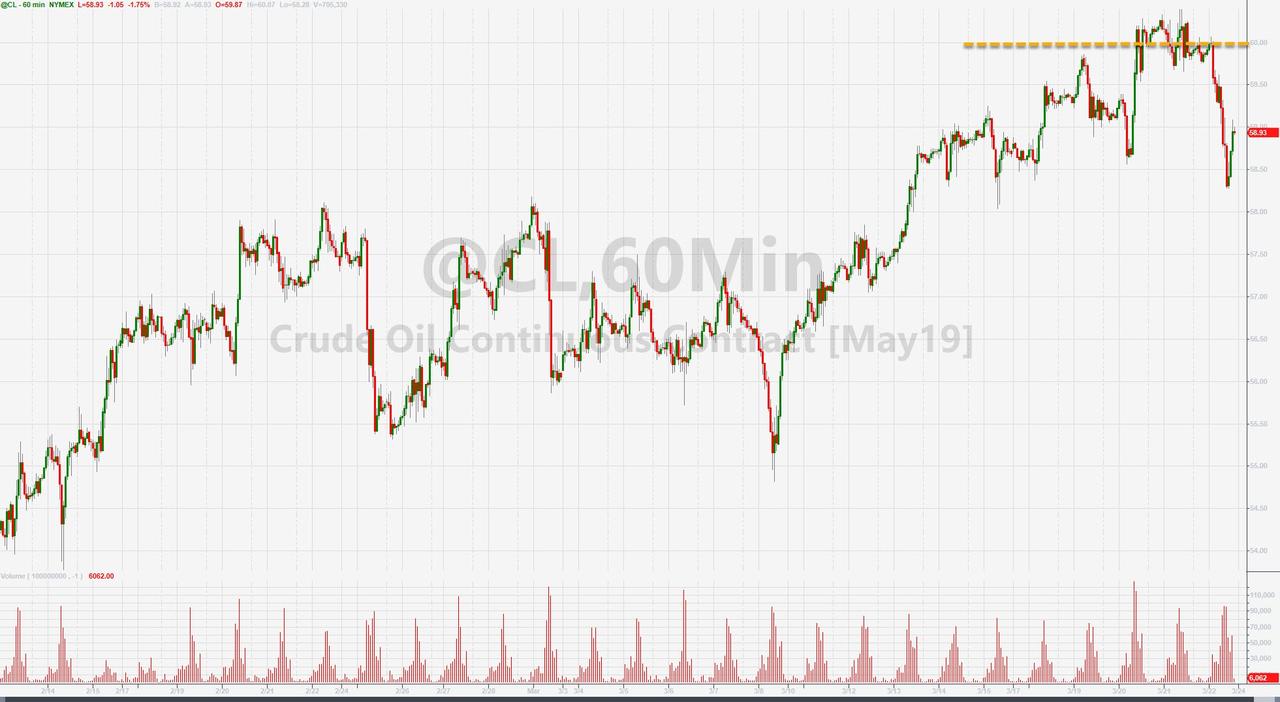
WTI topped $60 intraweek, but ended back below $59...
(Click on image to enlarge)
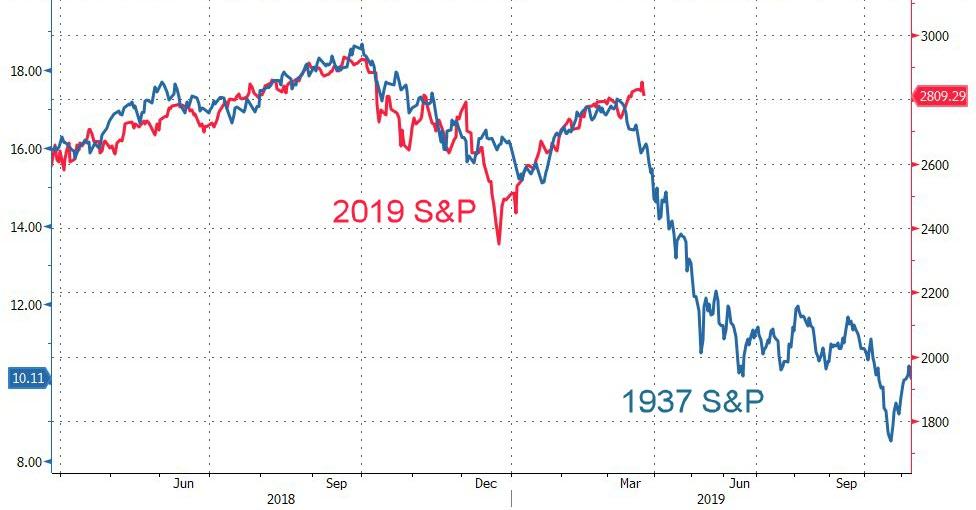
Finally, we refer to Knowledge Leaders Capital Bryce Coward's analysis of what happens next...
(Click on image to enlarge)
We’ve cataloged all 20 uninterrupted 15% declines in the post-war period and documented what has happened afterward, as well as the type of market environment in which those declines have taken place. By uninterrupted decline, we mean a waterfall decline of at least 15% without an intermediate counter-trend rally of at least 5%. Some bullet points describing the rallies following those declines are below:
-
The average counter-trend rally following a 15% waterfall decline is 11.9% (11% median) and it takes place over 21 trading days on average (median 11 days).
-
The rallies end up retracing 57% of the decline on average (median 52%).
-
Waterfall declines of at least 15% have only taken place in bear markets.
-
The average of those bear markets have a peak-to-trough decline of 33% (median 29%)
-
The duration of those bear markets is 284 trading days on average (median 139 days)
-
In 16 of 19 instances (excluding the decline we just witnessed), a recession was associated with the bear market
-
-
100% of the time the low resulting from the waterfall decline was retested, and in 15 of 19 cases, a new lower was made.
It's different this time though...
(Click on image to enlarge)