
As January Goes...
It is said that those who ignore history are condemned to repeat it. As such, analysts on Wall Street spend an inordinate amount of time on what are called historical analogs and seasonal patterns in the market. The idea to look back at the past and look for historical tendencies.
When the calendar pages flip from the end of one year to the next, there are several historical tendencies to observe. And given that many of these seasonal tendencies involve the performance of the stock market during the month of January, I thought this might be a good time to check in on the various trading tendencies and "rules" for the year.
First up, there is the "Santa Clause Rally" (also known as the "Year End Rally"), which looks at the stock market's performance during the last 5 trading days of the year and the first 2 trading days of the new year. As the saying goes, "When Santa fails to call, the bears will rule Broad and Wall."
The idea here is since this period of time tends to be positive for stocks, if this rally doesn't happen, the bears are likely to be in charge of the game.
The good news is that, as you've likely heard by now, the S&P 500 gained 0.8% during the Santa Rally period this time around. Chock one up for the bulls.
Next up is the "First 5 Days of January" Rule. In short, the "rule" says, "As the first five days of January goes, so goes January." I'm not exactly sure how this so-called "rule" came to be, but according to the Trader's Almanac, when the first 5 days of January are positive, the S&P has been up the rest of the year 79.4% of the time and has enjoyed an average gain of 9.7% during the February through December period.
On the flip side, if the first five days are negative, the market has been up only 51.6% of the time in the ensuing eleven months and the mean return was a discouraging -1.2%.
So, the fact that the S&P 500 was up 1.4% during the first five days of January is a good thing.
Then there is the "January Barometer," which states, "As January goes, so goes the year." Once again, the Trader's Almanac has the stats over the last 94 years to back up this one. History shows that when January is positive, the S&P has been up on the year 78.9% of the time, enjoying a gain of 8.6% during February through December.
Conversely, when January is negative, the market is up only 58.3% of the time and sports an average return of just 2.1% from February through December.
So, again, the fact that the S&P rose 6.29% (using SPY as a proxy) in January can be viewed as a positive omen for the rest of the year.
But wait, there's more. The Trader's Almanac also follows something called "The Seasonal Trifecta." This occurs when the Year-End rally, the First 5 Days of January, and the January Rule are all positive. And for those of you keeping score at home, this is one of the years when the "Seasonal Trifecta" is in play.
How has the stock market acted in years when the Seasonal Trifecta has been positive, you ask? First of all, it's a relatively rare thing as it has only happened 38 times in the last 94 years. And as you might suspect, the market tends to do well when these historical "rules" are all positive. In fact, the market has been up 86.8% of the time here with the mean return for the S&P 500 during the February through December period coming in a healthy 12.2% rate.
This compares quite favorably to the historical average for all years where the market has advanced 58.9% of the time, with the mean return of 2.0%.
And if this isn't enough historical extrapolation for you, you'll be pleased to learn that the Trader's Almanac has one more scenario to consider. The Seasonal Trifecta in years following a bear market. This situation is even more rare as it has happened just 17 out of the last 94 years. However, the good news is the S&P 500 has been higher during the ensuing February through December period 94.1% of the time and returned 13.9% on average. Not bad, eh?
So, there you have it. Using history as their guide, investors can't be blamed for looking ahead to pretty solid returns in the stock market for the remainder of the year. Fingers crossed!
Now let's review the "state of the market" through the lens of our market models...
Primary Cycle Models
Below is a group of big-picture market models, each of which is designed to identify the primary trend of the overall "state of the stock market."
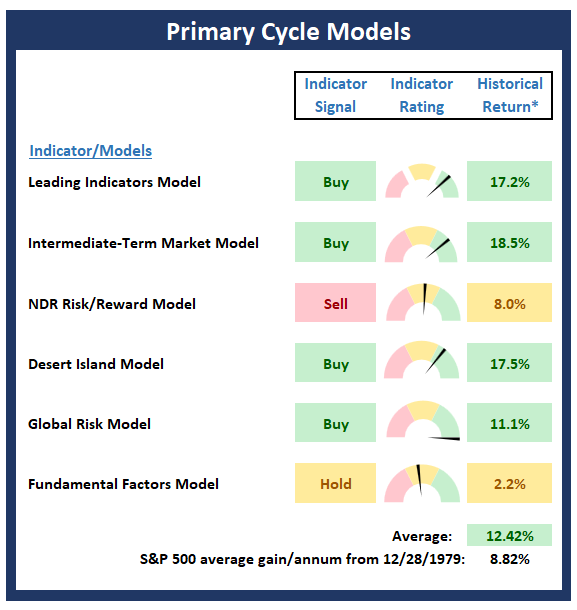
* Source: Ned Davis Research (NDR) as of the date of publication. Historical returns are hypothetical average annual performances calculated by NDR.
Trend Analysis
Below are the ratings of key price trend indicators. This board of indicators is designed to tell us about the overall technical health of the market's trend.
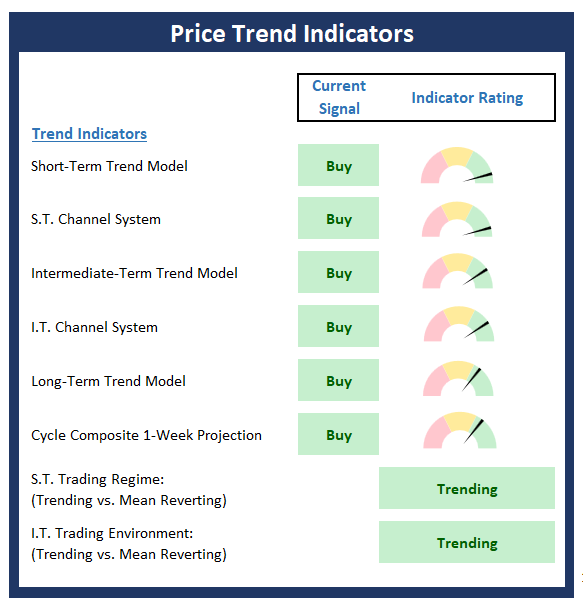
Key Price Levels
- S&P 500 Near-Term Support Zone: 4103
- S&P 500 Near-Term Resistance Zone: 4195
- S&P 500 50-day Simple MA: 3957
- MA Direction: Rising
- S&P 500 200-day Simple MA: 3950
- MA Direction: Declining
Market Momentum Indicators
Below is a summary of key internal momentum indicators, which help determine if there is any "oomph" behind a move in the market.
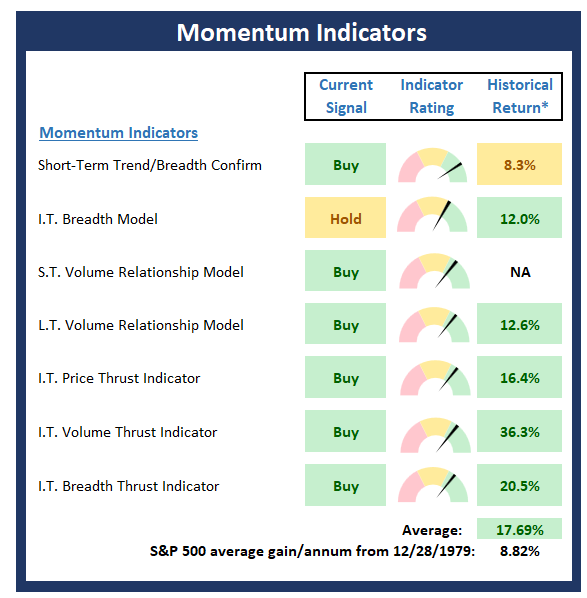
* Source: Ned Davis Research (NDR) as of the date of publication. Historical returns are hypothetical average annual performances calculated by NDR.
Early Warning Indicators
Below is a summary of key early warning indicators, which are designed to suggest when the market may be ripe for a reversal on a short-term basis.
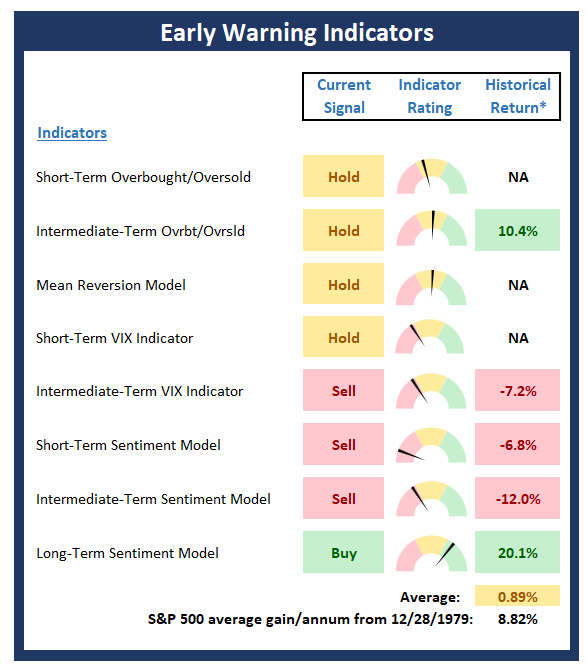
* Source: Ned Davis Research (NDR) as of the date of publication. Historical returns are hypothetical average annual performances calculated by NDR.
Fundamental Factor Indicators
Below is a summary of key external factors that have been known to drive stock prices on a long-term basis.
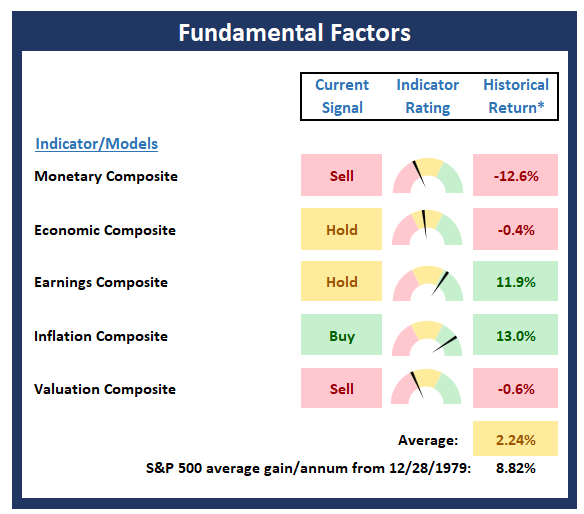
* Source: Ned Davis Research (NDR) as of the date of publication. Historical returns are hypothetical average annual performances calculated by NDR.
More By This Author:
Are The Bulls Back?
A Matter Of Timing
The Most Important Chart Of The Year
Disclosure: At the time of publication, Mr. Moenning held long positions in the following securities mentioned: None - Note that positions may change at any time.
NOT INDIVIDUAL INVESTMENT ...
more

