
Are Miners Showing Strength, Compared To Gold?
Did something catch your attention yesterday? If so, it could have been mining stocks’ strength relative to gold. Or so it seems… until we get a closer look.
In short, the GDX ETF moved higher yesterday, even though gold moved lower. This is a sign of strength of the former, which might be viewed as something bullish. But should it be viewed as such?
In my opinion – no. One swallow doesn’t make a summer, and a daily data outlier could be nothing more than that. Acting on gold’s daily, unconfirmed breakout, would have one buy gold at the end of the previous week. And as we’ll soon discuss, it wasn’t such a good idea after all.
So, why did miners rally?
Ultimately, it’s never possible to reply to the “why did a given market move” other than to say that “because buyers won over sellers”. It’s not particularly informative, though. The reason that seems most likely to me is that it was… a purely technical development that “needed” to happen for a formation to be complete.
This hypothesis would also explain the one odd thing that happened yesterday. Namely, while the GDX closed the day slightly higher, the GDXJ ended the day lower. This would make sense if the general stock market declined (junior mining stocks – GDXJ tend to follow its lead more than seniors – GDX) – but the point is that the general stock market ended yesterday’s session basically flat (declining by mere 0.09% decline).
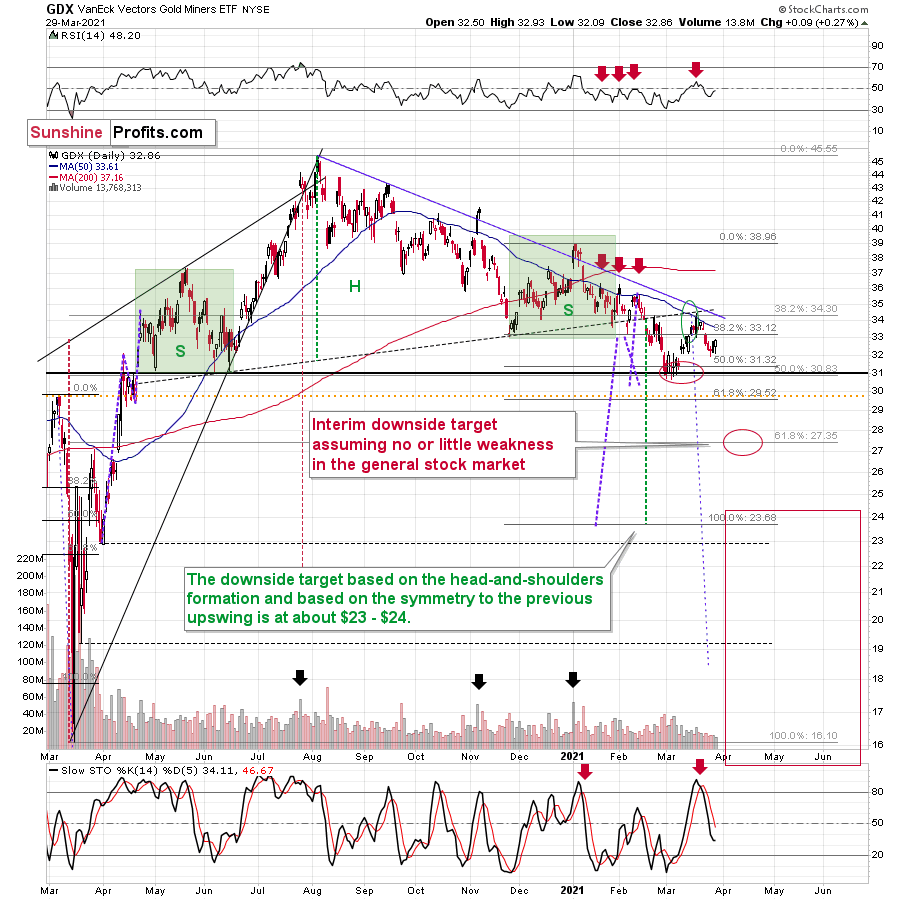
Ok, so what kind of formation are miners completing?
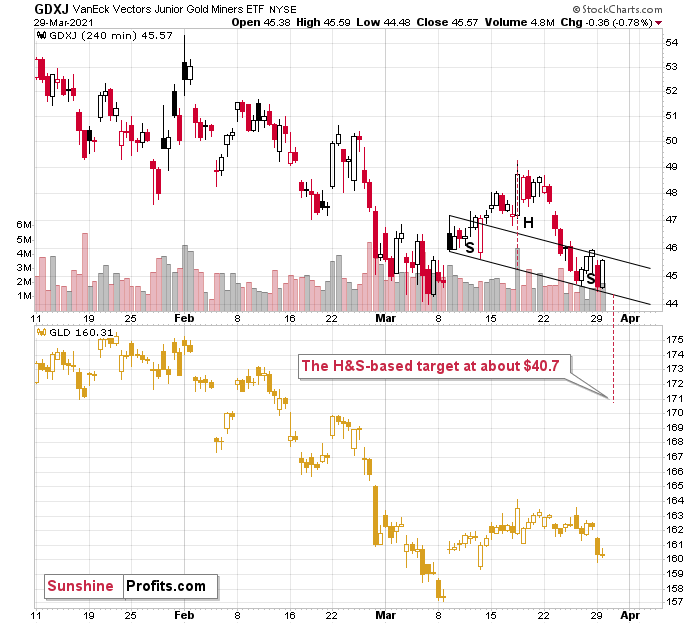
Quite likely the head and shoulders formations. The reason for yesterday’s underperformance of the GDXJ would be the fact that in case of this ETF’s head-and-shoulders formation, the neckline is descending much more visibly. These formations are more visible on the 4-hour charts – so, let’s zoom in.
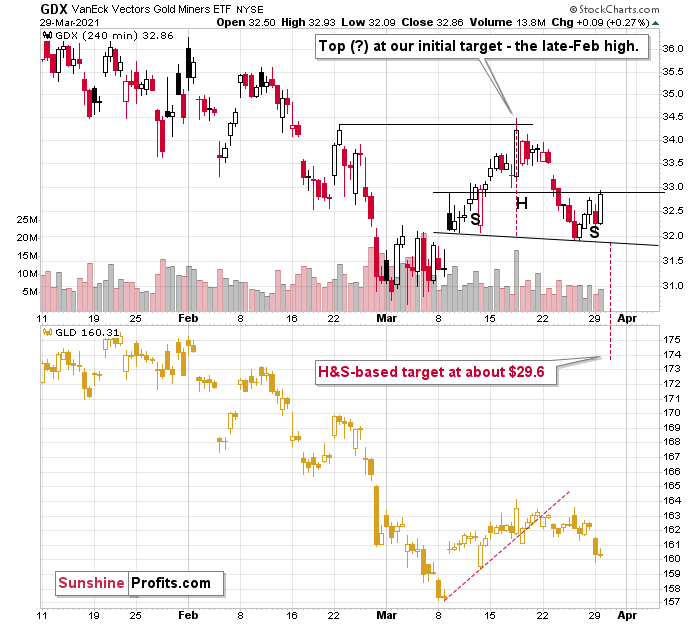
Currently – based on yesterday’s (Mar. 29) closing prices – the formations are not yet completed, so they should be viewed as “potential”. Still, given today’s (Mar. 30) pre-market decline in gold, it seems that they will be confirmed shortly, and the entire scenario outlined above will become reality (the recent decline will have turned out to be just the right shoulder of a bearish head-and-shoulders pattern).
The price targets based on those formations are $29.6 and $40.7 for GDX and GDXJ, respectively. However, let’s keep in mind that the H&S-based target should be viewed as “minimum” targets, not necessarily the final ones.
Let’s take a look at gold.
In yesterday’s analysis, I wrote the following:
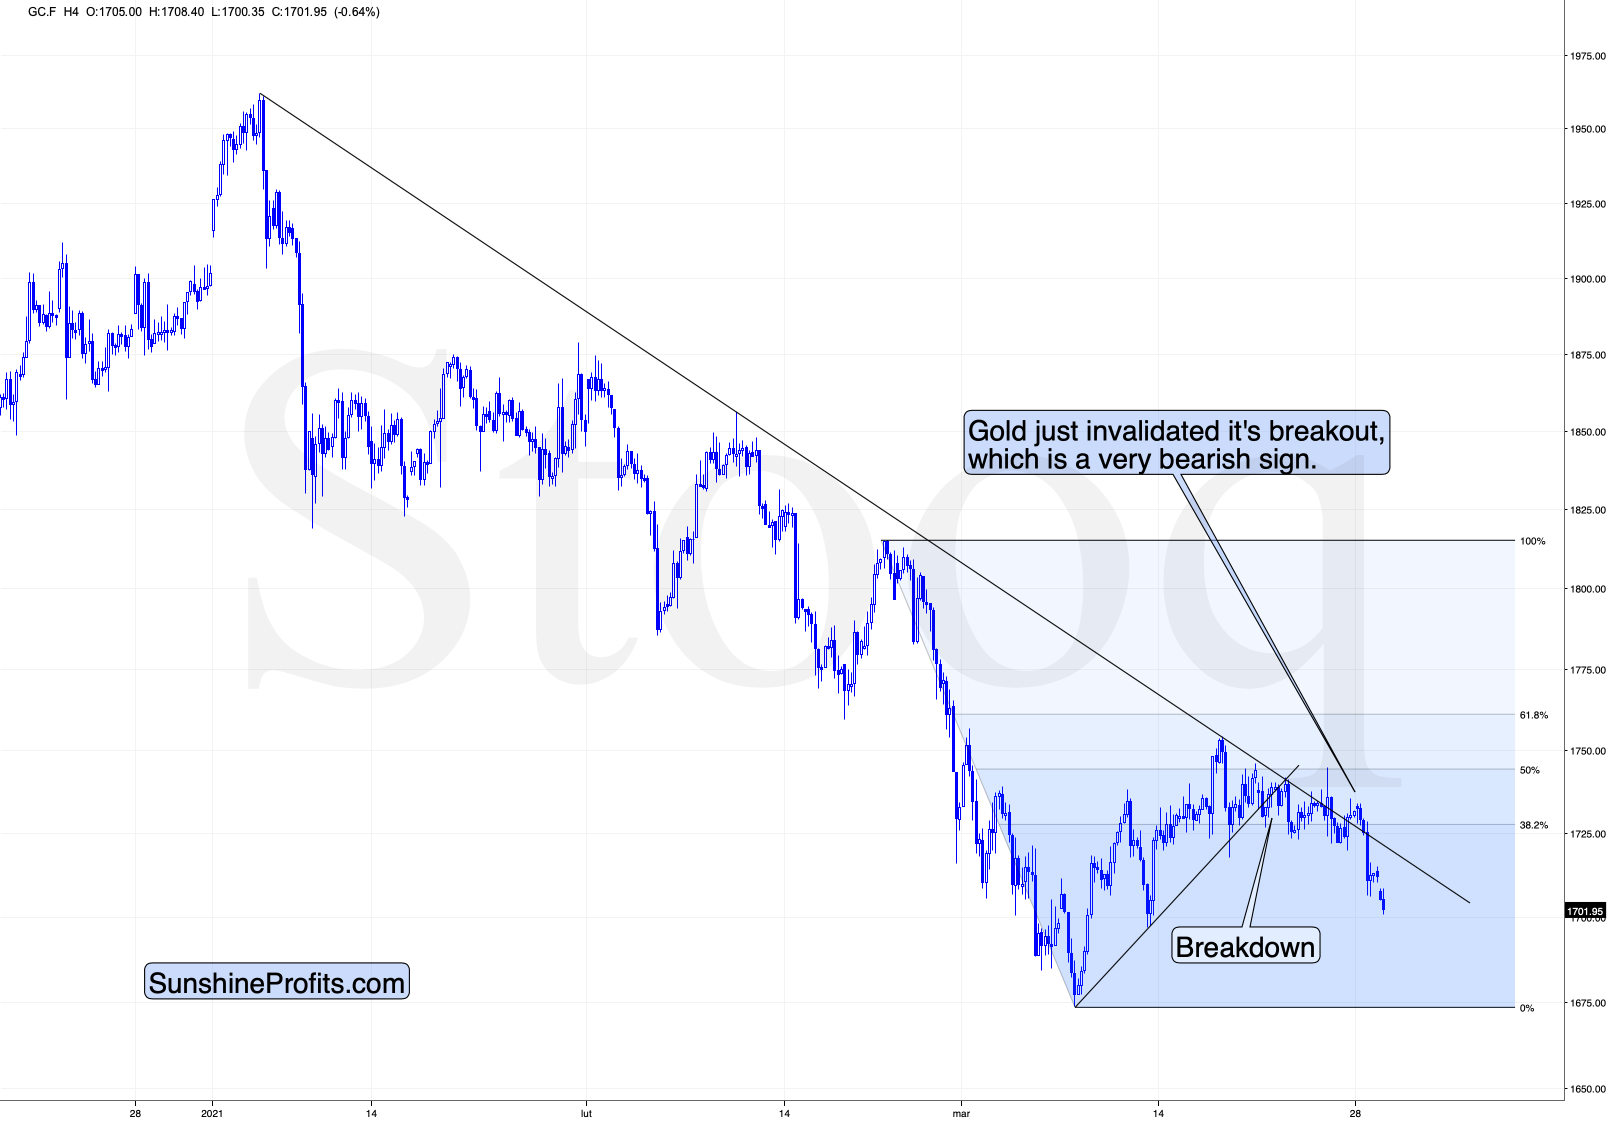
At the moment of writing these words, gold is trading once again very close to the previously broken line, ready to invalidate the breakout. If it does invalidate it (by moving below $1,725), then the bullish potential created by Friday’s rally will be gone.
Does the possibility (!) of seeing a temporary upswing imply that it’s a good idea to close our short positions? I don’t think so. In my view, the risk of missing the decline is too big and the situation in the USD Index is too bullish right now, to justify this action.
In short, gold just invalidated its small breakout above the declining resistance line. The previous breakout was small and thus it required a confirmation. It never got one, and instead gold plunged, invalidating the move. This is yet another sell sign.
It’s no wonder that gold is sliding. After all, gold tends to react more to breakouts and breakdowns in the USD Index than to its regular moves.
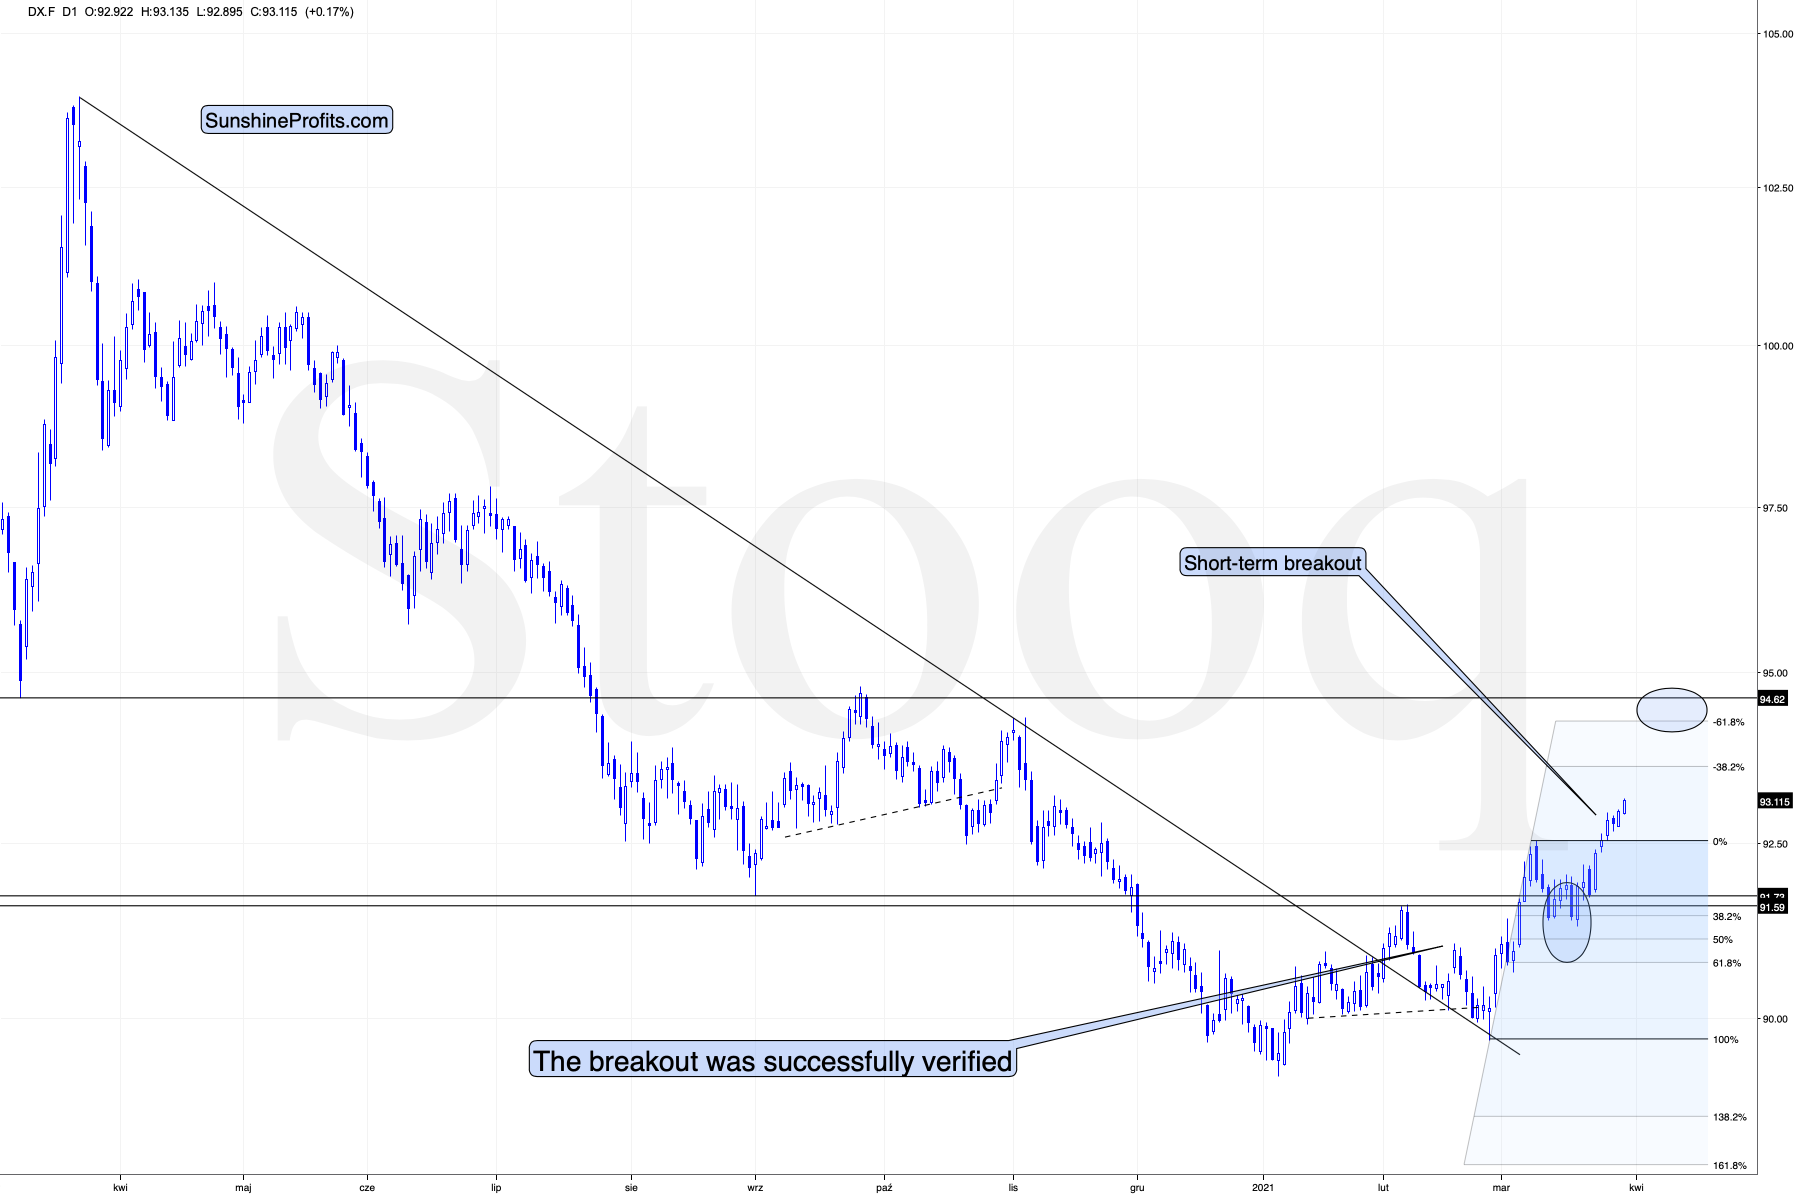
The thing is that the breakout to new yearly highs in the USD Index is now clearly visible. Yesterday’s close was the third consecutive daily close that we saw above the February high, which means that the breakout was confirmed. This a big deal from the short-term point of view, and it means that the road is now fully open for the U.S. currency index to soar to about 94.5 (before rallying even higher).
On Thursday (Mar. 25), I wrote the following:
(…) The breakout in the USD Index is not yet confirmed, but it seems quite likely that it will be confirmed shortly. I would not be surprised to see a weekly close near the previous yearly highs (the February highs) and then a powerful rally next week. This – if it happens in the above-mentioned way – would be likely to result in a major slide in the PMs next week.
The USD Index has indeed closed the week near the previous yearly highs (not right at them – apparently the USDX was too strong do decline right to them) and we see the beginning of a powerful rally this week. We also see the beginning of a major slide in the PMs this week. At the moment of writing these words, gold is already down by over $30 this week.
Disclaimer: All essays, research, and information found on the Website represent the analyses and opinions of Mr. Radomski and Sunshine Profits' associates only. As such, it may prove wrong ...
more

