
Altcoins Ethereum And Litecoin: Elliott Wave Analysis
Not much change in the Crypto market, but what is interesting is that most of the correlated markets can be now nearing target/resistance levels.

Image Source: Pixabay
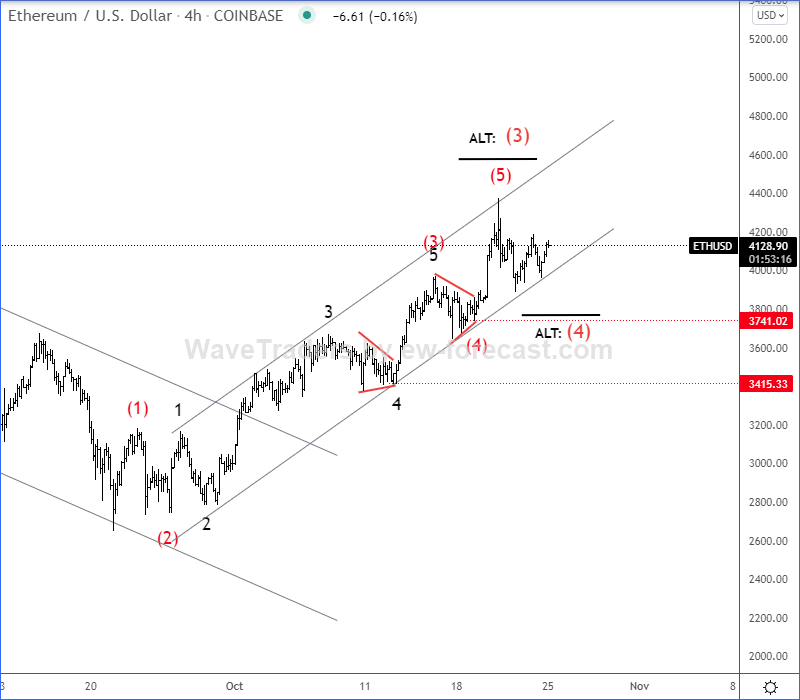
Ethereum came higher into the key 4100-4500 resistance area in the 4-hour chart as expected, but keep in mind that this could be the final stages of a higher degree wave C of a bigger daily flat correction, as we see a completed five-wave cycle. However, we don't see any significant decline to confirm the top yet, so the current wave structure could be still alternatively as part of wave (4) that can retest the highs for wave (5) again. Key support is in the 3800-3400 zone, but any bigger decline below 3400 would be an indication that bears are back.
Ethereum 4h Elliott Wave Analysis
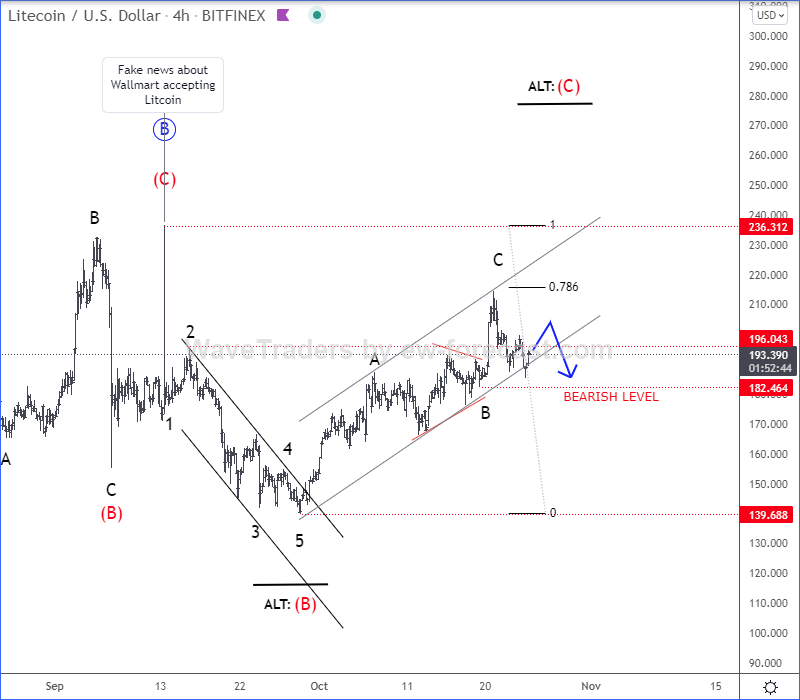
Litecoin came up in the 4-hour chart as expected, but now into key 78,6% Fibonacci and 200-220 resistance area for a potential wave C of an A-B-C correction. So, if LTC suddenly drops sharply back below the channel support line and 176 region, then bears would be back in the game, however, according to daily count #2, there's still a chance for higher prices, but only if goes back to 236 level.
Litecoin 4h Elliott Wave Analysis
Disclosure: Please be informed that information we provide is NOT a trading recommendation or investment advice. All of our work is for educational purposes only.


