
All Of The World’s Money And Markets In One Visualization (2020)
(Click on image to enlarge)

In the current economic circumstances, there are some pretty large numbers being thrown around by both governments and the financial media.
The U.S. budget deficit this year, for example, is projected to hit $3.8 trillion, which would be more than double the previous record set during the financial crisis ($1.41 trillion in FY2009). Meanwhile, the Fed has announced “open-ended” asset-buying programs to support the economy, which will add even more to its current $7 trillion balance sheet.
Given the scale of these new numbers—how can we relate them back to the more conventional numbers and figures that we may be more familiar with?
Introducing the $100 Billion Square
In the above data visualization, we even the playing field by using a common denominator to put the world’s money and markets all on the same scale and canvas.
Each black square on the chart is worth $100 billion, and is not a number to be trifled with:
(Click on image to enlarge)

In fact, the entire annual GDP of Cuba could fit in one square ($97 billion), and the Greek economy would be roughly two squares ($203 billion).
Alternatively, if you’re contrasting this unit to numbers found within Corporate America, there are useful comparisons there as well. For example, the annual revenues of Wells Fargo ($103.9 billion) would just exceed one square, while Facebook’s would squeeze in with room to spare ($70.7 billion).
Billions, Trillions, or Quadrillions?
Here’s our full list, which sums up all of the world’s money and markets, from the smallest to the biggest, along with sources used:
(Click on image to enlarge)
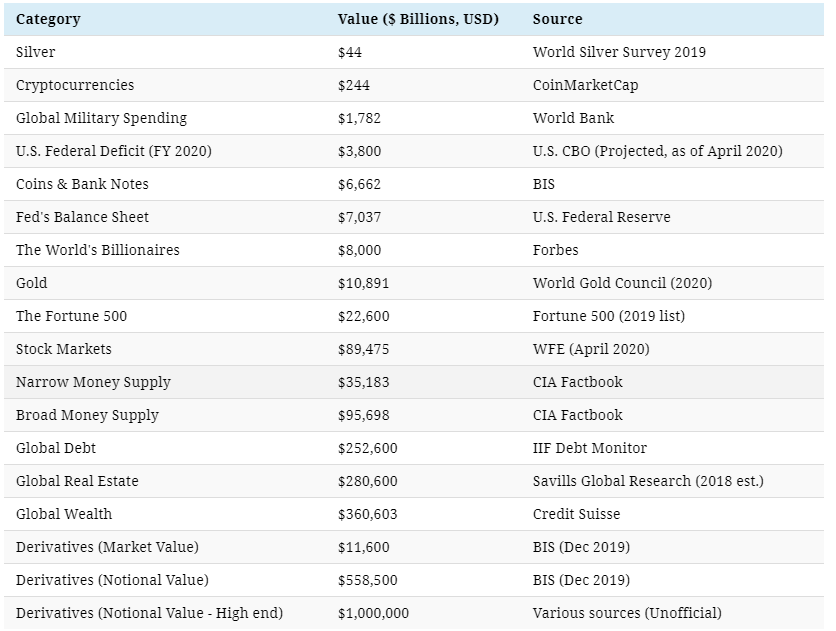
Derivatives top the list, estimated at $1 quadrillion or more in notional value according to a variety of unofficial sources.
However, it’s worth mentioning that because of their non-tangible nature, the value of financial derivatives are measured in two very different ways. Notional value represents the position or obligation of the contract (i.e. a call to buy 100 shares at the price of $50 per share), while gross market value measures the price of the derivative security itself (i.e. $1.00 per call option, multiplied by 100 shares).
It’s a subtle difference that manifests itself in a big way numerically.
Disclosure: None


Good infographic.
This is a great way to view wealth. Cool!