
Air Comes Out Of The USD Hot Balloon
In Forex, the USD drew all the attention with realized volatility exploding to a 6-standard deviation from pre-COVID19 measures while the rest of currencies in the G8 FX complex stabilize between 1 and 2-std deviations. The world’s reserve currency ended up weakening the most this year as it registers a third straight day of losses. Want to find out all the drivers and my train of thoughts? Keep reading...
Quick Take
Equites keep roaring ahead for a third straight day as the US Senate approved (vote 96-0) the $2tn fiscal package, with President Trump to sign it off shortly. Wonder how much that really is? In our Discord room, our CEO Jeremy made the following analogy to put $1tn into perspective: ”A million seconds is 12 days. A billion seconds is 31 years. A trillion seconds is 31,688 years.” Governments and Central Banks have gone in a short period of time above and beyond to desperately plug the endless economic holes of a global economy suddenly paralyzed. I find quite fitting this quote from Lenin to contextualize the tsunami of developments. "There are decades when nothing happens; and there are weeks when decades happen." In Forex, the USD drew all the attention as the huge realized volatility shows, exploding to a 6-standard deviation from pre-COVID19 range measures whereas the rest of FX stabilized circa 2-std deviations. The world’s reserve currency ended up weakening the most this year as it registers a third straight day of losses. Note, this negative correlation with US equities is far from coincidental, as the $2tn fiscal package aids the equity market as ample funding is made available to citizens/enterprises, which in turn leads to a decrease in the VIX (fear index), hence the run for cash (USD) is less urgent. Expect the correlation between the VIX and the USD to remain at highly elevated levels in this new market framework/paradigm unfolding. The currencies most recently hit the hardest - AUD, NZD, GBP - put on the best performance. Sandwiched in between, EUR, CHF, JPY (funding/risk-off currencies) showed tepid fragility as risk picked up.
(Click on image to enlarge)

Narratives In Financial Markets
* The Information is gathered after scanning top publications including the FT, WSJ, Reuters, Bloomberg, ForexLive, Twitter, Institutional Bank Research reports. If you found this fundamental summary helpful, just click here to share it!
US equities printed gains for a 3rd straight day: Equities surges as risk sentiment prevailed on the basis that the US Senate finally approved (vote was 96-0) the $2tn fiscal package. The bill now moves to the House of Representatives to vote before President Trump signs it off.
Equities ignore record spike in US jobless claims: The S&P has recouped over 20% from its Monday’s lows despite the unprecedented spike in US weekly jobless claims. It registered the largest increase to 3,283k vs 282k the prior week. The previous one-week highs was in Oct 1982, at 695k claims, and March 2009, at 665k.
Never forget markets are a discounting mechanism: The reaction in equities is what’s often referred in the trading arena as “sell the rumor and buy the fact” and it suggests that the dire collection of economic news that is to come in the following weeks appears to be, by and large, discounted by Mr. Market. Further selling in equities may continue to kick in based on the technical bear trend, but not necessarily triggered by economic data.
Warning on increased vol: The Global FX Committee (GFXS) issued a statement warning of a pick up in volatility in the days to come due to month-end benchmark fixings: "Given the intense volatility seen in global financial markets this month, it is possible that FX market participants may execute larger than usual FX volumes during end-of-month benchmark fixings.”
No quick fix for gold market: As Reuters reports, "U.S. exchange operator CME Group on Tuesday announced a new gold futures contract to combat price volatility caused by the shutdown of gold supply routes, but traders and bankers said it would not immediately calm markets."
BoE a non-event: The Bank of England issued its latest policy statement with little effects in the GBP given the previous emergency actions conducted to address the COVID-19 crisis. The recent measures introduced included the lowering of rates to 0.1% and GBP200bn of QE. The bank warned of a ‘very sharp’ downturn and risk of ‘longer-term damage to the economy.’
Good news in the UK: UK Chancellor Rishi Sunak announced a grant for the self-employed workers worth 80% of their average monthly profits to help them cope with the economic shock. The money - up to £2,500 a month - will be paid in a single lump sum, but will not begin to arrive until the start of June at the earliest. GBP traders saw the news as a positive input.
Powell speaks, market listens: Fed Chair Powell, in a TV interview, reassured the market that the Fed has enough firepower: “We’re not going to run out of ammunition”, adding that the Fed would keep providing credit lines “aggressively and forthrightly where it is not available and should be offered.” Powell went on “this is a unique situation, this is not a typical downturn.”
G20 commitment undeterred: The G20 conducted an emergency virtual summit, and issued an official statement outlining that “we will continue to conduct bold and large-scale fiscal support”. The leaders also stated as part of the final communique that "we are injecting over US$5 trillion into the global economy, as part of targeted fiscal policy, economic measures, and guarantee schemes to counteract the social, economic and financial impacts of the pandemic.”
ECB scraps QE legal limits: The Central Bank has done so disregarding the legal and political implications, by increasing its flexibility to ramp up its plan to buy bonds up to €750bn to stem the financial fallout from the coronavirus. Christine Lagarde, the ECB’s president, said on Twitter after it was announced last week: “There are no limits to our commitment to the euro.”
More air is coming off the USD balloon: All instruments, be it forex, commodities, equities, appreciated against the USD as the $2tn fiscal package keeps supporting the equity market as ample funding is made available to citizens/enterprises, which in turn leads to a decrease in the VIX (fear index). The correlation between the VIX and the USD is as strong as it gets in recent weeks.
No end in sight to Oil price war: Despite the mounting pressure by the US to Saudi Arabia to find a resolution to ease the tensions between Saudi Arabia and Russia, the Oil price war looks set to extend. A post-meeting statement by the organization did not mention oil nor energy.
US overtakes China in COVID-19 cases: As part of new COVID-19 developments, the US officially overtook China as the country with the most cases. According to the NYT, at least 81,321 people have been diagnosed in the US, including more than 1,000 deaths. As the Times notes, “the US is suffering from a shortage of personal protective equipment and ventilators.”
Recent Economic Indicators & Events Ahead
(Click on image to enlarge)

Source: Forexfactory
Insights Into Forex Flows
The Euro index has entered a range-bound phase for the last week worth of trading with the measures of volatility firmly at 2 standard-deviations from pre-covid 19 levels.
Interestingly, after battered mercilessly, it is now the Pound that shows renewed fortitude by validating a change in structure as a series of previous highs are taken out with heightened vol still the norm (as in the case of the EUR, it also runs at 2-std deviations from its base levels pre-covid19).
Without a doubt, the currency drawing most of the attention is the USD, weakening the most this year as volatility explodes into the 6-std deviation box!
Meanwhile, vol in the Canadian Dollar has been suppressed to just 1-std deviation as part of a context that is still inducing technically-oriented traders to short it off the 50% fib retracement. Similarly, the Yen index, run at 1-std deviation in realized vol in the last 24h as it keeps testing an area that has proven to be a buyers’ stronghold.
By combining the CAD and JPY index, it definitely makes the case for an attractive level to consider shorts in CAD/JPY subject to one’s trading system.
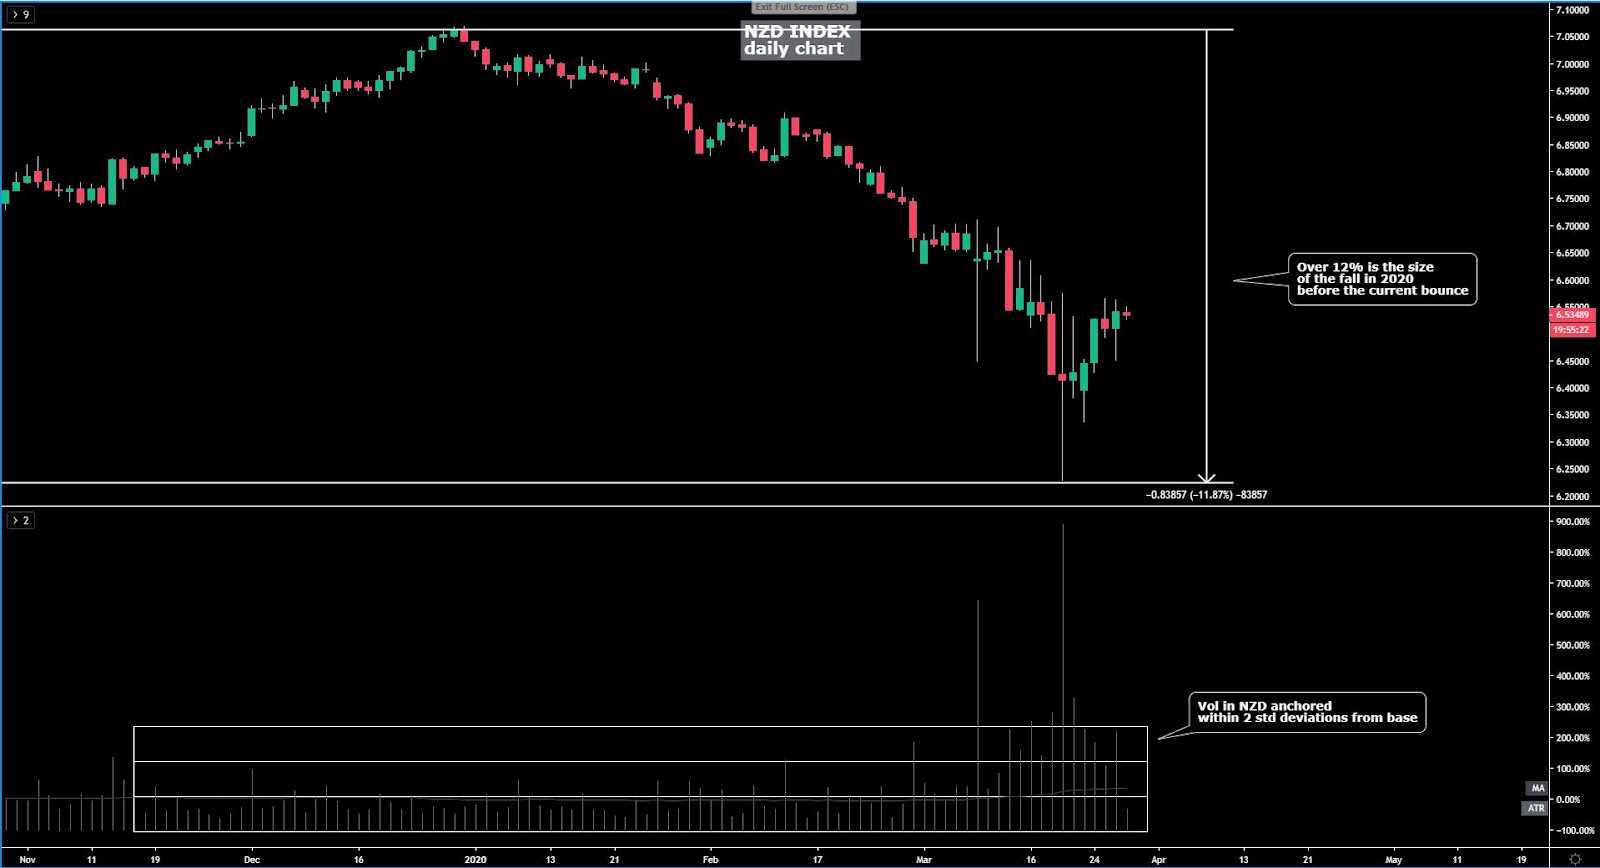
The AUD index continues to offer a fair share of vol as it stabilizes at the 2-std deviation mark from its old depressed range. Again, what this means is that if we were used to a range of 50 pips in AUD/USD, it’s now the new normal to see the AUD/USD to cover a range of 150 pips on average. The exact same conditions can be found in the Kiwi index.
Lastly, the Swissy, still in a firmm trend, has paused its vol to just 1-std deviation with notable dip buying still present.
Let’s now get started with a visual look and annotations prepared for every index…
(Click on image to enlarge)

(Click on image to enlarge)

(Click on image to enlarge)

(Click on image to enlarge)

(Click on image to enlarge)

(Click on image to enlarge)

(Click on image to enlarge)
(Click on image to enlarge)

Important Footnotes
Market structure: Markets evolve in cycles followed by a period of distribution and/or accumulation. To understand the principles applied in the assessment of cycles, refer to the tutorial How To Read Market Structures In Forex
Horizontal Support/Resistance: Unlike levels of dynamic support or resistance or more subjective measurements such as Fibonacci retracements, pivot points, trendlines, or other forms of reactive areas, the horizontal lines of support and resistance are universal concepts used by the majority of market participants. It, therefore, makes the areas the most widely followed and relevant to monitor. The Ultimate Guide To Identify Areas Of High Interest In Any Market
Fundamentals: It’s important to highlight that the daily market outlook provided in this report is subject to the impact of the fundamental news. Any unexpected news may cause the price to behave erratically in the short term.
Projection Targets: The usefulness of the 100% projection resides in the symmetry and harmonic relationships of market cycles. By drawing a 100% projection, you can anticipate the area in the chart where some type of pause and potential reversals in price is likely to occur, due to 1. The side in control of the cycle takes profits 2. Counter-trend positions are added by contrarian players 3. These are price points where limit orders are set by market-makers. You can find out more by reading the tutorial on The Magical 100% Fibonacci Projection
The Daily Edge is authored by Ivan Delgado, Head of Market Research at Global Prime. The purpose of this content is to provide an assessment of the market conditions. The report takes an in-depth ...
more

