
About 40 Years Of Inflation Expectations Errors – Economists Vs. Households
From the Michigan consumer survey and the Survey of Professional Forecasters:
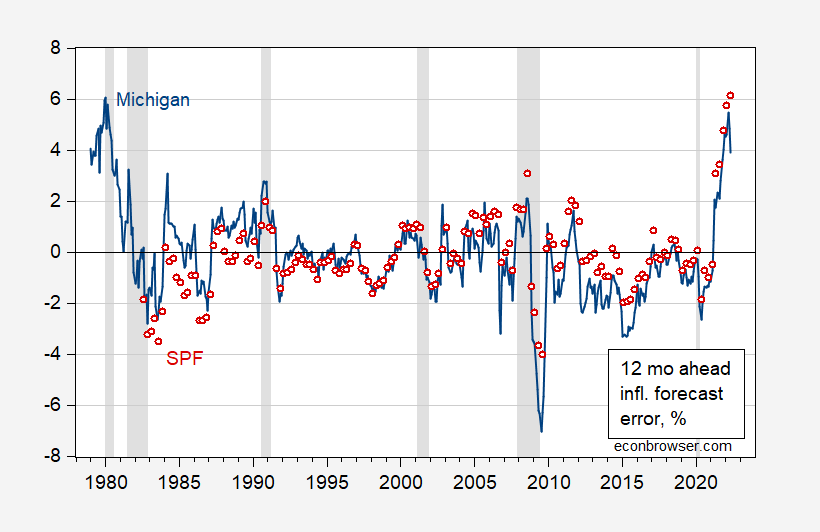
Figure 1: Michigan 12 month ahead forecast error (blue), and Survey of Professional Forecasters median forecast error (red), in percentage points. NBER defined peak-to-trough recession dates shaded gray. Source: BLS via FRED, University of Michigan via FRED and Philadelphia Fed, NBER, and author’s calculations.
Since these are 12 month ahead forecasts sampled at a higher frequency than the horizon — monthly (for MIchigan) or quarterly (for SPF) — these errors are based on overlapping forecasts.
To see nonoverlapping forecasts, I sampled at May of each year:
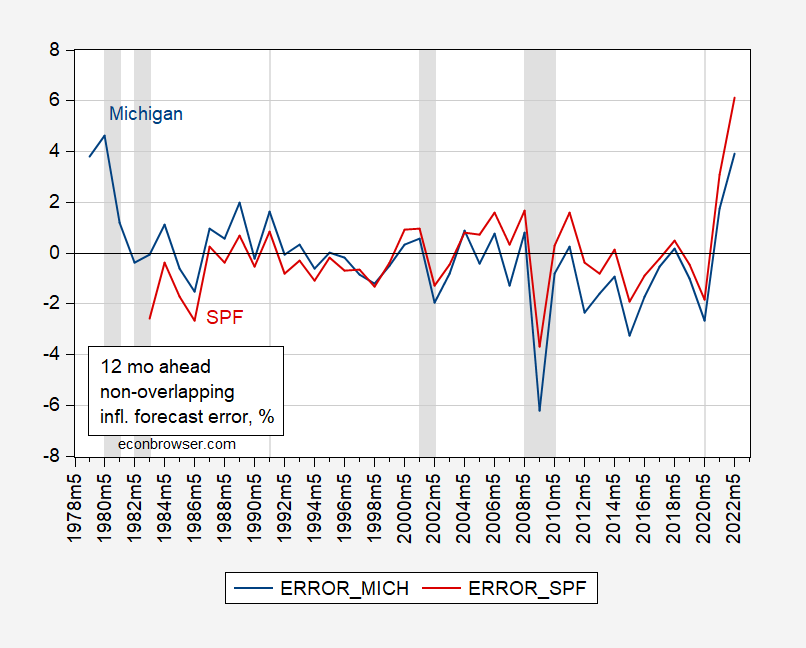
Figure 2: Michigan 12 month ahead forecast error (blue), and Survey of Professional Forecasters median forecast error (red), in percentage points, in May. NBER defined peak-to-trough recession dates shaded gray. Source: BLS via FRED, University of Michigan via FRED and Philadelphia Fed SPF, NBER, and author’s calculations.
From 1986M05-2019M05, SPF forecasts exhibited smaller error than Michigan (18 bps vs 43 bps), and smaller root mean squared error (12 bps vs. 15 bps). (See more discussion of different characteristics of professional economists’ views vs. households, see this post.) Obviously, since the pandemic’s onset, this pattern has reversed – although there are only 3 non-overlapping observations, so it’s hard to judge statistical significance.
To summarize, during the Great Moderation, professional forecasters did better (and exhibited less upward bias) than consumers/households. That relationship might have been upset during the pandemic. However, in both cases, forecast errors were highly correlated (adjusted R2 at 0.68).
Disclosure: None.


