
A Way To Own The S&P 500 With Better Risk And Opportunity Optionality
Summary
- A 50/50 mix of XLG and RSP produced virtually the same results over 15 years as 100% SPY.
- The 50/50 mix provides optionality to modulate market-cap and equal weight exposure not available through SPY.
- SPY is good for increasing or decreasing risk with options, while the 50/50 mix is not.
If you own the S&P 500, which accounts for roughly 85% of all US stocks market-cap, your return is effectively controlled by the largest 10 or 20 stocks in the index, because the index is market-cap weighted.
If you want to modulate your relative exposure to those largest stocks either up or down, you can't do it with SPY. You either have to add stocks or funds heavy in the large stocks to increase the exposure, or short those stocks or funds to reduce the exposure (can also be done with options). That can work well too but is more work than many investors are prepared to incur.
There is an easy and uncomplicated way to be able to modulate exposure between the few large stocks that dominate return and the many smaller stocks that are along for the ride in the index. That easier method may also give you more flexibility in the timing and extent of gain or loss realization.
Instead of owning SPY or VOO (the two dominant S&P 500 index ETFs), you could own a 50/50 mix of the largest 50 stocks through XLG and an equal weighted index of all 500 stocks (RSP). In an equal weighted index, at each rebalance the largest stock has the same weight as the smallest stock (AAPL instead of being 6+% of the fund is only 0.2% of the fund, and the smallest companies, such as Xerox would also be weighted 0.2% instead of 0.01% as in the S&P 500).
Currently, the top 50 stocks in the S&P 500 have a 54.4% weight and the remaining stocks have a 45.6% weight - close to a 50/50 mix.
Let's see how a 50/50 mix of XLG and RSP with quarterly rebalancing compared to owning only SPY.
You will see the results are essentially equal, but with the 50/50 mix, you have the optionality to change the weight between the very large and the rest, and to realize gains and losses at different times and to different extents between the largest and the rest.
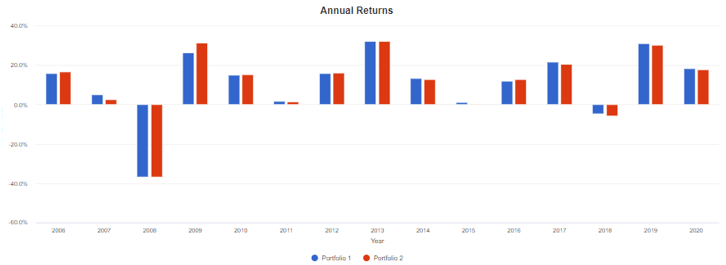
In these graphics SPY (portfolio 1) is shown in blue and the 50/50 XLG/RSP blend (portfolio 2) is shown in red.
Over the last 15 calendar years, the return of the two-portfolios has been very close each year.
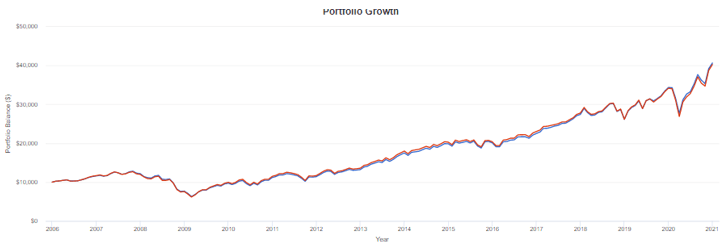
Viewed as a continuous compounding at monthly intervals the comparison looks like this - almost identical:
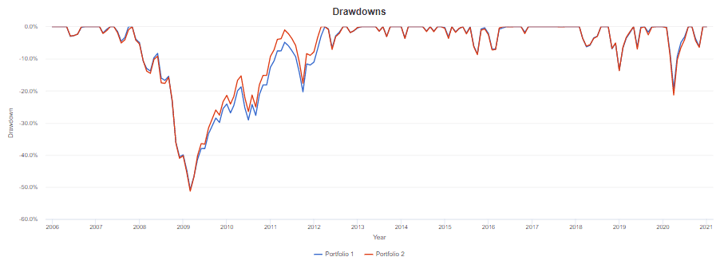
Maximum drawdowns are also quite similar:
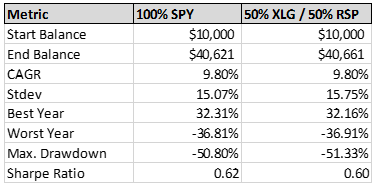
This table quantifies the similarities and differences in performance of the two approaches. Over 15 years the cumulative difference on a $10,000 investment is $40 (virtually nothing). The 50/50 portfolio is marginally more volatile, and its worst year was down 0.10% more than SPY. On an intra-year basis the worst drawdown was down 0.53% more than SPY.
A tabular view of annual returns looks like this:
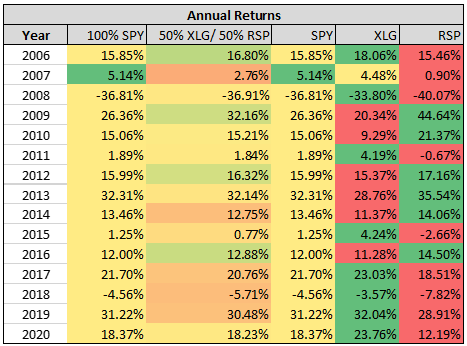
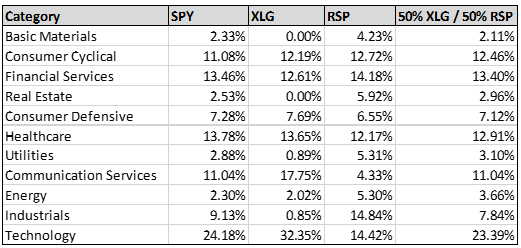
The sector composition of XLG and RSP are different, but in the 50/50 mix, the sector allocation is quite similar to the S&P 500:
With the 50/50 model you can change your mix of market-cap weighted or equal weighted exposures, and you can realize gains or losses on one part of the S&P 500 while keeping the other part in place.
An important negative is one that few of you are likely to find impacts you is the availability of options to increase or decrease risk. There is a deep, liquid market of options on SPY and little for XLG or RSP. So, if options were your thing, then the 50/50 model is not a good idea, but otherwise it may be worthy of consideration.
Disclaimer: "QVM Invest”, “QVM Research” are service marks of QVM Group LLC. QVM Group LLC is a registered investment advisor.
Important Note: This report is for ...
more

