
A Strategy For Volatile Markets
Investors often look for ways to enhance income, lower a portfolio’s overall expected volatility and mitigate risk.
In this post, we focus on how a specific type of option strategy employed in the WisdomTree CBOE S&P 500 PutWrite Strategy Fund (PUTW) seeks to enhance portfolios during these volatile markets.
PUTW’s Strategy: Cboe S&P 500® PutWrite Index
PUTW seeks to track, before fees and expenses, the price and yield performance of the Cboe S&P 500® PutWrite Index (PUT Index). The PUT Index includes a strategy of writing at-the-money puts on a monthly basis.
You can think of a put option as an insurance contract. The writer plays the part of the insurer, who charges the owner a premium to ensure the price of their underlying asset if it were to fall below the strike price agreed upon in the contract.
The options sold by the PUT Index use the S&P 500 Index (S&P 500) as the underlying asset. The strategy writes the put contracts on the third Friday of each month and these expire (mature) on the third Friday of the following month.
“At the money” means the strike price agreed to on these contracts is equal to the current price of the S&P 500.
For example, on March 20, 2020, the PUT Index strategy wrote a contract with an expiration date of April 17, 2020, and a strike price of 2,450. The S&P 500 Index traded around those levels at the time of this transaction.
Options written by the PUT Index settle on the day of expiration. There are two potential outcomes, dependent on the price of the S&P 500:
- If the price of the S&P 500 at settlement is at or above the strike price, the PUT Index will keep the full premium it initially collected. The PUT Index will not experience the return of the S&P 500 over this period as its upside will be capped by the premium initially collected.
- If the price of the S&P 500 is below the strike price, the PUT Index is required to pay the difference between the strike price and the current level of the S&P 500. This difference can be more or less than the premium initially collected.
Given this payoff structure, the month-to-month upside of the PUT Index is capped by the percent premium it collects (premium collected/strike price), while the downside depends on the movement of the S&P 500, which can be mitigated by the premium initially collected. The PUT Index will have a shock absorber equal to the percent premium it collected.
On April 18, 2019, this strategy wrote a put expiring one month later (May 17) with a strike price of 2,895, collecting at a premium of $29.40 per contract, equivalent to 1.02%. The below hypothetical payoff diagram shows the potential outcomes at expiration. If the price of the S&P 500, shown in the horizontal axis, finishes above 2,895, the PUT Index will keep the $29.40 it collected, realizing a return of 1.02%. The upside for this contract will be capped at 1.02% regardless of a potentially larger positive move in the S&P 500.
Hypothetical Payoff Diagram
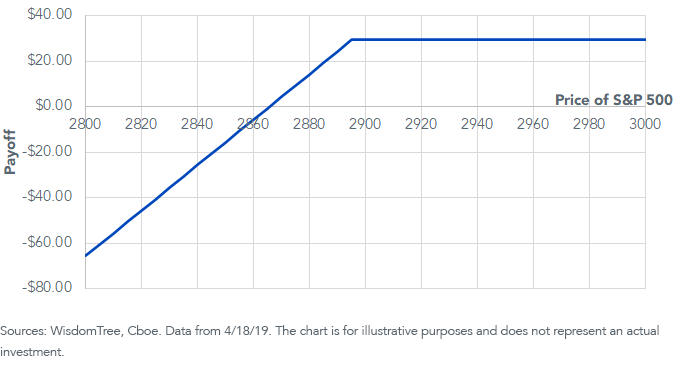
If the price of the S&P 500 is below 2,895, the PUT Index will need to pay the difference between the strike price and the current price of the underlying asset.
For example, if the S&P 500 were to fall -1.20% to 2,860, the PUT Index would owe $35; therefore it would be returning the $29.40 it initially collected plus an additional $5.60, netting a loss of -$5.60 or -0.18% (1.02% - 1.20%) on the transaction. The premium collected would’ve absorbed the first -1.02% of the adverse market movement.
The Role of Market Volatility
The premium charged by the PUT Index is determined by, among other things, the probability of the event occurring (the probability of the S&P 500 dipping below the strike price) and the maturity of the contract.
Think of it like a traditional homeowner’s insurance policy. The premium charged to a homeowner living in a coastal region to insure their home against flooding damage would be higher than one charged to a homeowner living in the mountains. And the one-time premium charged by the insurance company would be higher if the coverage lasts for two hurricane seasons compared to only one.
The PUT Index is a rules-based strategy, so most of the variables that determine the price of these put contracts—like time to maturity and strike price (as a % of the underlying asset)—remain constant month to month. The biggest driver in determining the contract’s premium is the probability that the S&P 500 Index dips below the strike price. This probability is greater as volatility in the markets increases. The most used market gauge to measure volatility is the VIX Index (VIX).
As we see below, the premium collected by the PUT Index (as a percent of the strike price) increases when market volatility increases.
Looking at the past 12-plus years of data, we can approximate the percentage of monthly premium collected to be close to the level of the VIX divided by 10.
PUT Index Premium (%) vs. VIX Index
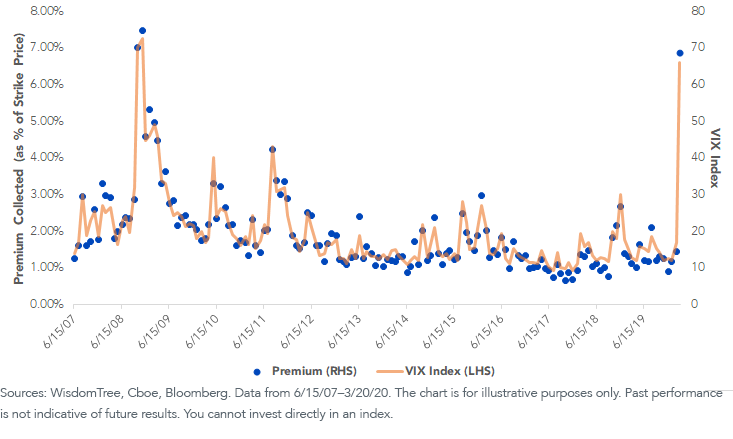
A put-writing strategy relies on the premium collected, which is typically measured as a percentage of the strike price.
For example, the strategy wrote a put on the S&P 500 with a strike price of 2,450 on March 20, 2020, and collected a $168.50 premium—equivalent to 6.88%—a level not seen since the financial crisis in 2009. This 6.88% represents the shock absorbance the strategy will have in case the S&P 500 falls over the next month, and it also represents the maximum return the strategy could experience before writing its next put option.
Put-Writing in Periods of Volatility
Both the upside capture (which is limited to the premium collected) and downside mitigation (a higher premium gives the writer a larger shock absorber in case the price of the underlying asset falls below the strike price) of a put-writing strategy depends on the percent of premium collected when writing the options. So, the strategy underlying the PUT Index tend to work best in periods of higher market volatility.
Below, we see how relative performance between the S&P 500 and PUT Index has been driven primarily by the total premium collected in a given year, which in turns depends on the average level of the VIX.
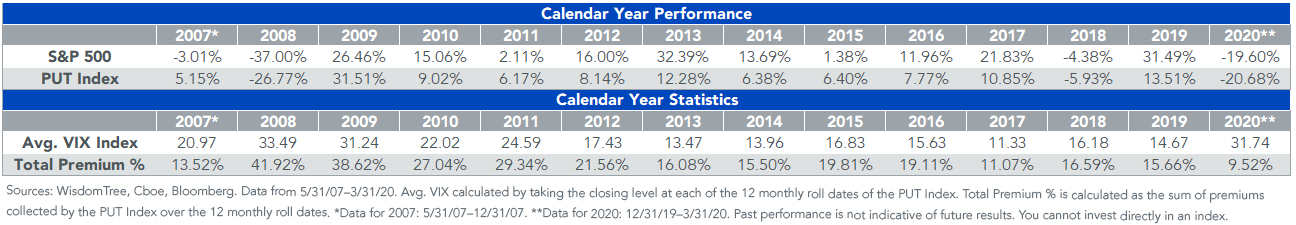
For example, 2008 and 2009 were some of the best relative performance years for the PUT Index, and also years when the market experienced both significant downturn and recovery. This relative outperformance can be explained by the fact that during those years, the PUT Index collected a total of 42% and 39% in premiums respectively, giving the strategy an increased cushion in the downside and also capping the upside at significantly high levels.
On the other hand, 2017 was a year in which the PUT Index trailed the S&P 500 by more than 10%. It was also a year with the lowest volatility exhibited in recent history, measured by both the VIX and market standard deviation. The premium collected by the PUT Index in 2017 was equivalent to 11.07%, so its upside was capped at that level, while the S&P 500 went on to have an almost 22% increase.
Given the rocky start of the year and the uncertainty the world is facing, we would expect volatility to continue being an important driver in 2020.
Investing in a strategy that seeks to harness this volatility in its favor, like PUTW, could complement your portfolio.
Unless otherwise stated, data sources are WisdomTree and Cboe, as of 3/31/20.
Disclosure:
Important Risks Related to this Article
There are risks associated with investing, including possible loss of principal. The Fund will invest in derivatives, including ...
more

