
A Major Breakout Has Occurred In S&P 500
Another record closing week for the major indices, with all 3 achieving new all-time highs. Additionally, the S&P 500 (SPX) closed above 3,000 for the week and with a .78% move higher for the week ended 7/13/2019. No, the gains weren’t tremendous for the week, but closing above 3,000 is a feather in the cap for most investors and favors investor psychology going forward.
S&P 500 Record Close

In deciphering the health of the 2019, 20% rally in the S&P 500, we continue to monitor the overall breadth of the market. Recall from last week’s Research Report the following:
“Additionally, as of Friday’s closing, 75% of stocks in the S&P 500 are now above their 200-day moving average, the most since February 2018. This suggests the market’s rise has been broad-based over the course of the first 6 months of the calendar year, but may also be very near a temporary peak and subsequent retracement.”

And with a strong looking breadth, we now aim to look at how many stocks are trading above their respective 50-DMA. Again, this exercise is to determine the strength/health of the 20% rally; is it real and are the vast majority of stocks participating. (Chart from Troy Bombardia)
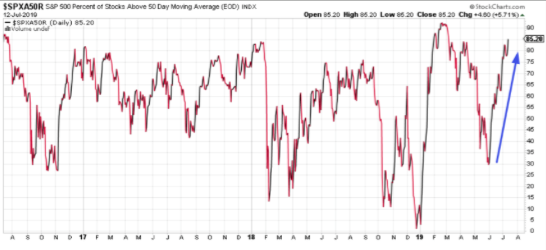
With more than 85% of stocks trading above their 50-DMA it is very clear that breadth is strong and this rally is healthy. How long it will last before executing a pullback remains to be seen. More importantly, we might desire to take a look at what history tells us about how the market performs when 85% of stocks are trading above their 50-DMA. (Table from Bullmarkets.co)
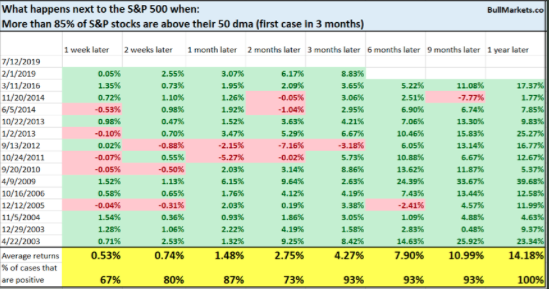
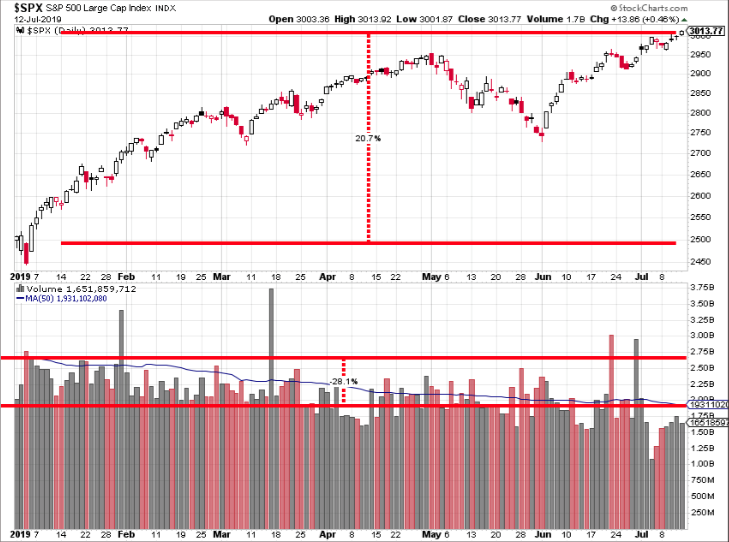
That looks like a sea of green ahead folks. While the near-term can prove choppy, it’s clear that institutional funds are dictating market moves when breadth is this strong and they may push the market to more highs over the next 3,6,9 and 12 months. So I mentioned institutional investors right, and why? Let’s take a look at the following chart that proves to be almost a perfect head-and-shoulders pattern with the right shoulder proving shallower than the left shoulder.
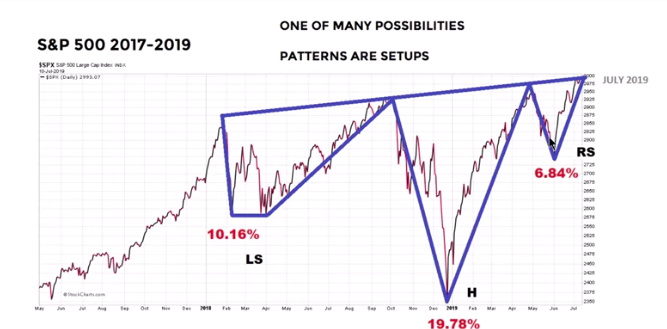
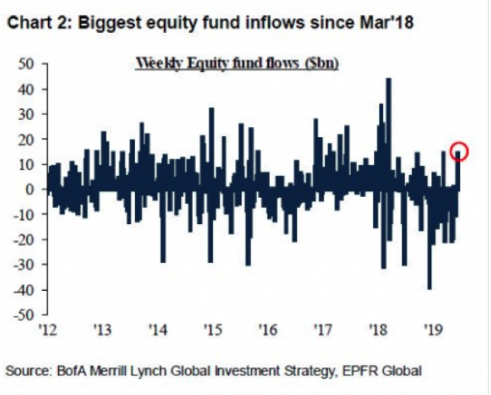
By examining the chart and understanding the majority of market volume comes via institutional funds, we can see that the left shoulder (LS) represents a deeper drawdown, likely inclusive of institutional funds. The head of the pattern (H) signifies greater fear in the market, brought about by a hawkish FOMC that was raising rates and signaling more rate hikes to come in 2019. But then came the pivot and institutional funds releveraged, shorts covered and the market rallied significantly through April. The right shoulder (RH) represents a roughly 7% correction in May, but much shallower than previous drawdowns and likely from retail investors by and large. Most market snapbacks with rapidity demand buy volume, which can only come from institutional funds. As we have mentioned previously, we validate the notion of institutional funds with recent Bank of America Merrill Lynch data as follows from nearly a month ago:
Does this mean that everyone is a believer in the 2019 rally? That’s hard to say because, for the year, fund flows have resulted in net outflows and in terms of YoY market volume… well, it hasn’t been bountiful, to say the least. S&P 500 volume is down some 28% year-to-date.
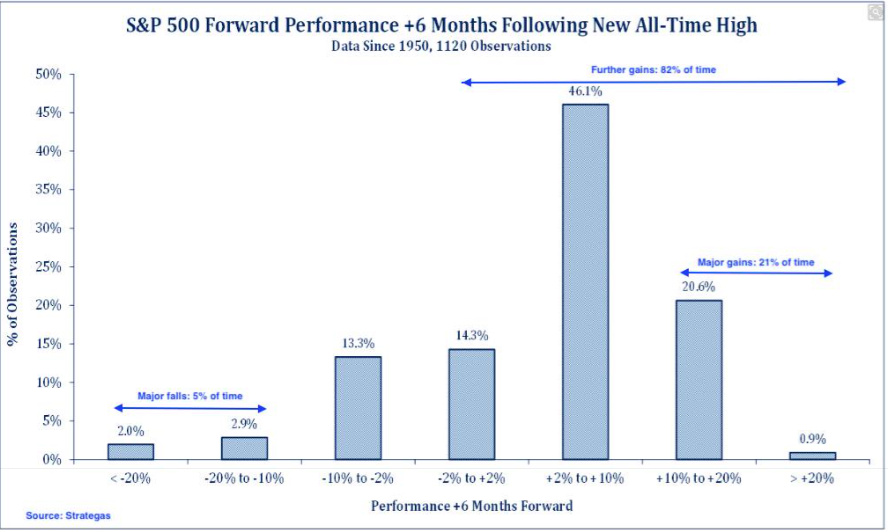
In recognizing how far and fast we’ve rebounded from the bear market low of 2018, it’s historically been suggested that gains beget more gains. We see this via market breadth and the table from Bullmarkets.co, but we can also see it expressed another way. In the following chart, we can see what happens after 6 months and after the S&P 500 makes an all-time high.
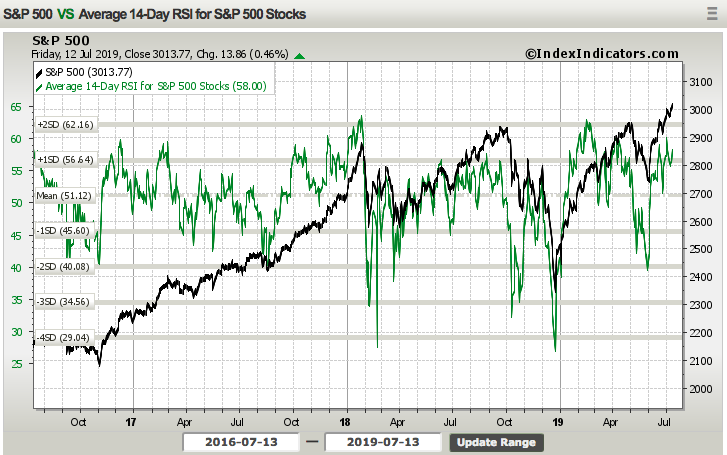
With the S&P 500 gaining under 1% in the past trading week, it also failed to move the relative strength index (RSI) very much. In fact, the 14-day RSI remains in relatively neutral territory, not exhaustive at all. It signifies the rally and slow grind higher in the S&P 500 over the last several months and with the index only 3% above an 18-month base around 2,945. It may seem like we’ve been hitting new highs through much of Q2 and into July, but they’ve been minor new highs.
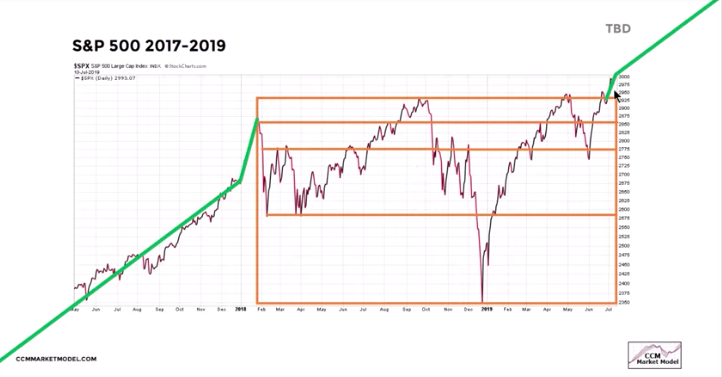
Finom Group (for who I am employed) is of the opinion that with strong market breadth ahead of earnings season that kicks into high gear this week, any market pullback should be viewed as a buying opportunity. Naturally, buying should adhere to a longer-term objective and with strategic deployment of capital. While earnings season may not prove to show YoY earnings growth, modest earnings declines will likely produce modest pullbacks in the market. Ultimately, the market setup over the last 18 months suggests the recent breakout of the consolidation channel should produce gains over the next 12 months. (See chart below)
For the market to produce a more substantial and elongated pullback, earnings & earnings forecast are likely necessary to deteriorate further and central bank accommodations will need to prove impotent.
Again, the S&P 500 gained some .78% in the week that was and barely touched the weekly expected move of $33/points. Moreover, volatility/VIX dropped another 6.7% for the week. With the drop in the VIX, we see that the coming week’s weekly expected move is reduced a bit to $32/points.

Economic Data
Before dipping our toes into the weekly economic data, we have to remember that we are now very likely entering an easing cycle. What is an easing cycle you might be asking? An easing cycle is a period of time whereby the FOMC eases financial conditions through various means, but mainly by lowering the Fed funds rate (FFR). This, in turn, serves to lower interest rates and boost economic activity, historically.
Unemployment is at a 50-year low and inflation is subdued and the household-debt-to-GDP ratio is declining. There are few signs of excesses in financial markets like the subprime mortgage lending of a decade ago, but stock markets and real estate prices are propped up by historically low-interest rates and the debt of non-financial businesses is at an all-time high of 74% of GDP. Nonetheless, while nothing seems overtly worrisome for the economic outlook based on the aforementioned, the Fed is going to cut rates, why? Well as chairman Jerome Powell testified last week:
“The slowdown in business fixed investment may reflect concerns about trade tensions and slower growth in the global economy,” he told the House Financial Services Committee on Wednesday.
Apparent progress on trade turned to greater uncertainty, and our contacts in business and agriculture report heightened concerns over trade developments,” he added. “Moreover, a number of government policy issues have yet to be resolved, including trade developments, the federal debt ceiling, and Brexit.”
Chairman Powell may not be worried about the U.S. economy to the extent some may be, but he is certainly worried about external or internal shocks from the trade feuds that remain unresolved.
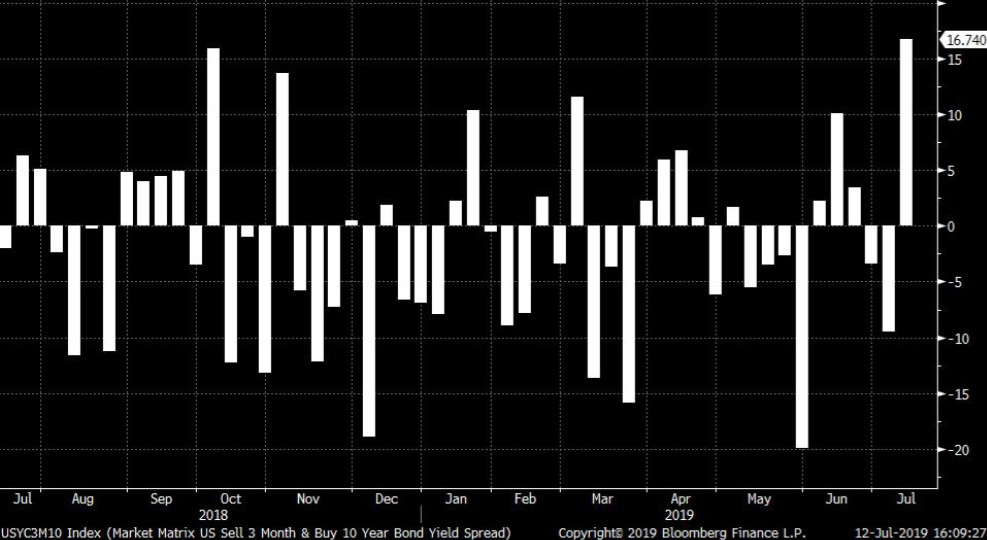
Moreover, with just the probability of the Fed easing, interest rates have been dropping at the long end of the bond yield curve for much of 2019. Unfortunately, the short end of the bond yield curve has seen as much of a drop and thus the 3-month/10-year yields have inverted and remain inverted for over 40 days now. After the latest Semiannual FOMC Testimony before Congress that signaled a July rate cut, the 3-month/10-year yields expressed the most significant steepening of the spread in the last year (Chart below). The inversion that was, is almost no more!
The markets tend to do very well during Fed easing cycles, especially if it rate cuts come without a recession. “The first Fed cut, when U.S. is not in recession, is a huge deal. 100% of the time we see a rally three months, six months, nine months, and 12 months out,” Thomas Lee, managing partner and head of research at Fundstrat Global Advisors said. “And the nine-month median gain is 18%, implying 3,300-3,400 for S&P 500”.
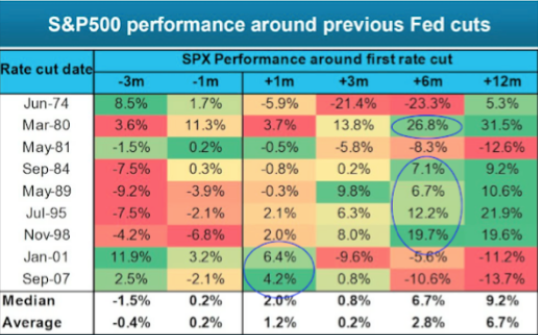
The only issue with Tom Lee’s statement is that in each of the last 4 non-recession easing cycles (’84, ’89, ’95 and ’98), the market was lower going into the first-rate cut. Obviously, that is not the circumstance ahead of the implied July 2019 rate cut. It begs us to ask the question: “Has the market already priced in the rate cut?”
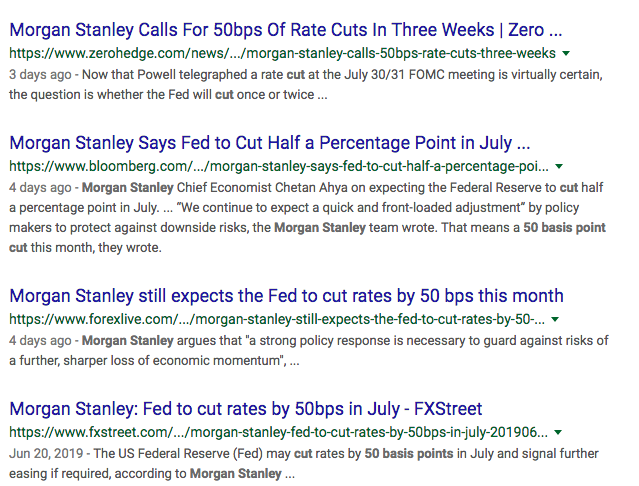
While that question remains unknown and may only come to be known with hindsight, Morgan Stanley’s chief cross-asset strategist, Andrew Sheets said in his latest research note:
“In light of these concerns and others, we are downgrading our allocation to global equities from equal-weight to underweight. The most straightforward reason for this shift is simple – we project poor returns.
“Our concern is that the positives of easier (Fed) policy will be offset by the negatives of weaker growth. We think a repeated lesson for stocks over the last 30 years has been that when easier policy collides with weaker growth, the latter usually matters more for returns.
For trivia fans out there, July 13-October 12 has historically been the worst 90-day period for equity returns since 1990, possibly because liquidity and risk appetite tend to worsen after 2Q results.
The market continues to believe we have this ‘Goldilocks’ situation. That stocks can continue to make new highs and a lot of assets can all perform well together. But there are a number of reasons we believe that this is not 2013 or 2015 or even the late 1990s, another period when the Fed cut and the markets did quite well.
For one, Wall Street’s expectations for earnings remain too high. When companies reported first-quarter results, they seemed reluctant to lower the financial forecasts for the year ahead. But since then, trade talks aimed at reaching a deal between China and the United States, which many believed was imminent as recently as the end of April, have broken down, and the economic data has weakened. That means that when companies start reporting second-quarter results, they are likely to issue forecasts that reflect a more difficult 12 months ahead.
Also, a number of economic measures looked more stretched than they did five years ago, when the labor market was still strengthening and consumer confidence was improving.”
By all accounts or at least that which lends itself predominantly to domestic growth, the economy seems to be performing well in spite of the looming trade feuds and manufacturing weakness. Even so, you’ve probably already seen many notes and depictions of the New York Fed’s recession model highlighting it is at its highest level prior to the last recession. The New York Fed’s Recession Probability Model is now at 32%, the highest in more than 10 years. Since 1968, a reading above 28 has coincided with a 100% chance of a U.S. recession within the next 12 months. That’s not a good sign seeing how it currently reads 33 percent. But what does it mean for equities historically?

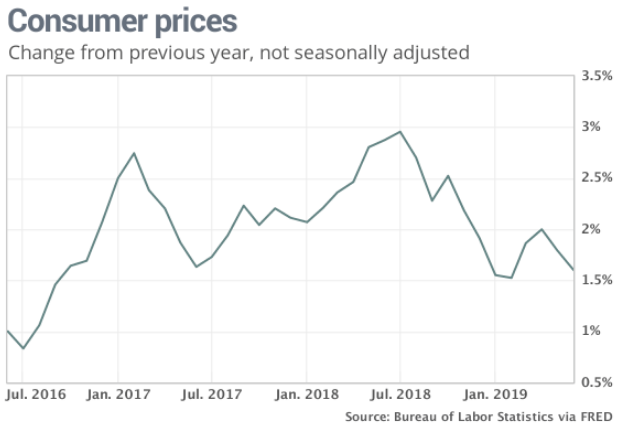
All anybody really focused on in the past week so far as economic data was concerned was the inflation data reports from the Producer Price Index and the Consumer Price Index. Why? Well because they have been falling ever since July of 2018, partly the cause for the Fed lowering its neutral rate outlook.
Excluding food, energy and trade margins, the so-called core PPI rate was flat last month after two straight months of 0.4% gains. The yearly rate of increase in core prices decreased to 2.1% from 2.3%.

The Consumer Price index didn’t fare much better than its peer inflation index. The consumer price index rose 0.1% in June, the government said Thursday. Economists polled by MarketWatch had forecast no change. The increase in the cost of living over the past 12 months slipped to four-month low 1.6% from 1.8%.
Most of the economic data continues to point in the direction of a slowing economy, but one that still expresses trend-growth. With a trade truce in place between the U.S. and China and a Fed easing cycle commencing, it remains to be seen if the economy can be accelerated in the back half of the year. With that being said, here is a calendar of economic data releases for the upcoming week. The data proves highly relevant to Q2 GDP revisions.
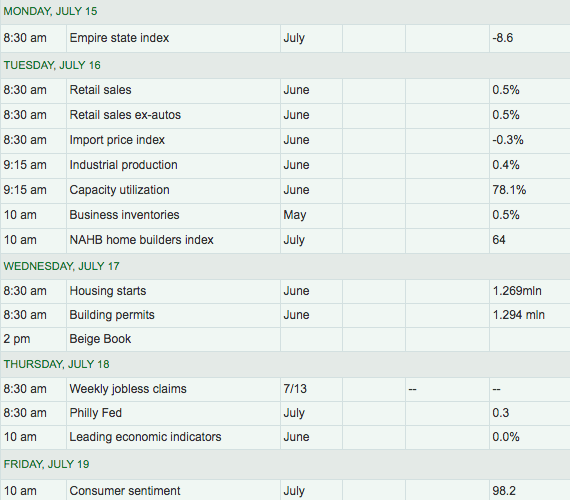
Retail sales will prove to be the headline report on Tuesday and after Monday’s release of the Empire State manufacturing index. Finom Group anticipates a rebound in the index from a severe drop in the previous reading. Nonetheless, Retail sales will be the more heavily anticipated data set come Tuesday and with recent favorable readings MoM and YoY.

May retail sales proved quite robust, up .5% MoM and up 3.2% YoY with a very strongly positive revision to the April retail sales data. The March 2019 to April 2019 percent change was revised from down -0.2 percent to up 0.3 percent.
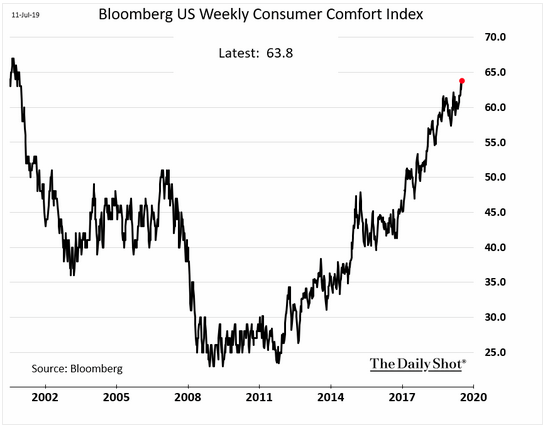
In addition to the recent retail sales data and positive revisions, the consumer seems to still be doing well, with a strong labor market supporting consumer spending. Bloomberg’s consumer comfort index continues to rise, approaching levels last seen in 2000.
While also keeping in mind that Citigroup (C) will report earnings on Monday and the big money center banks through the week, housing data will also headline the week and put a further spotlight on lending revenues from these banking institutions. Rounding out the week, investors and economists will also get the latest reading from the Philly Fed index and the Leading Economic Indicators (LEI). With all the relevant data and earnings spilling out for investors to consider next week, we would anticipate a tug of war between the bulls and bears and keep a watchful eye on Fed fund futures. What remains in question and maybe dependent on further economic data and earnings sentiment is whether the FOMC will cut by 25 bps or 50 bps.
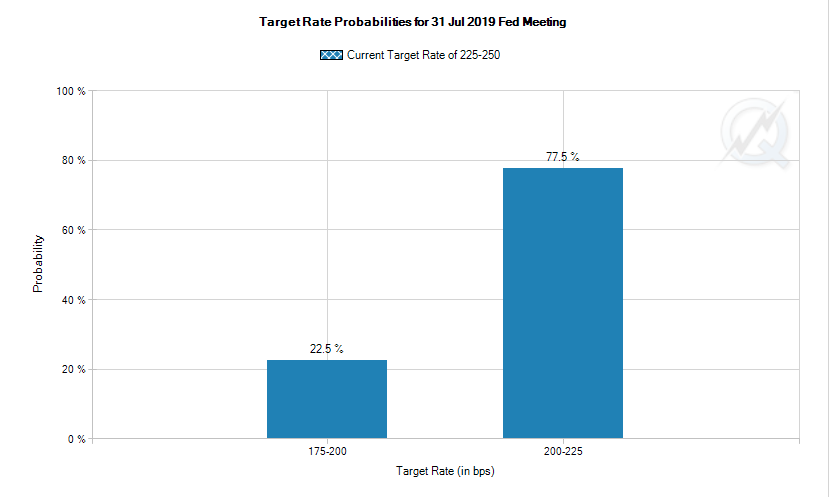
As of Friday’s close, the probability of a 25bps rate cut is still the greatest probability, according to the CME FedWatch Tool. Finom Group believes the Fed is more likely to cut rates 25 bps to see how big or small an effect it has on the economy and business sentiment. There are many that believe a 25 bps rate cut wouldn’t be stimulative enough and therefore a 50 bps cut is more likely.
“Historically the Fed has wanted shock and awe when they ease,” said Brent Schutte, chief investment strategist at Northwestern Mutual Wealth Management said in an interview. “ They’ve tried to exceed expectations when they ease” in order to maximize the effect on financial conditions and investor confidence.
“The case for a 50 basis point cut is consistent with academic research which says the closer you are to the neutral rate and the lower zero bound, the earlier you should act and the bigger the move should be,” Frances Donald, chief economist at Manulife Investment Management.
Fund Flows
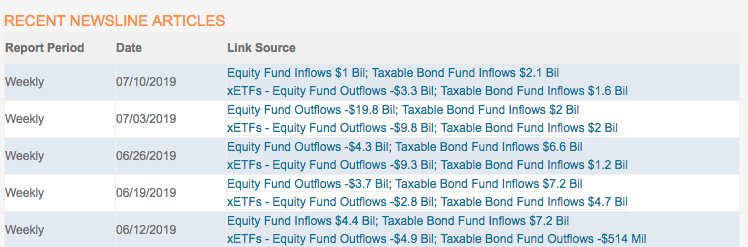
According to Lipper Weekly FundFlows reporting, for the week ended 07/10/2019 ExETFs - All Equity funds report net outflows totaling -$3.927 billion, with Domestic Equity funds reporting net outflows of -$2.606 billion and Non-Domestic Equity funds reporting net outflows of -$0.692 billion. ExETFs - Emerging Markets Equity funds report net outflows of -$0.141 billion. Net inflows are reported for All Taxable Bond funds of $2.109 billion, bringing the rate of inflows for the $2.964 trillion sector to $4.482 billion/week funds reported net inflows of $27.898 billion...ExETFs - Municipal Bond funds report net inflows of $0.885 billion.
In this week's ICI fund and ETF flow/issuance report, equity outflows totaled a sizable $28.8 billion. Of this amount, $25.2 billion represents outflows from U.S. domestic funds and ETFs. This is the second week in a row that equity flows have been negative. On the receiving end, bond funds and ETFs had inflows of $10.4 billion for the 6-day period ending July 2 and inflows of $10.5 billion in the prior week. ICI data is reported with a weekly lag.

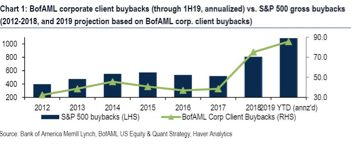
So with all these outflows, how is that the market can maintain its bullish bias and continue expressing record levels? The primary culprit, as discussed previously, remains corporate buybacks, which remain the primary source of market support in 2019. This is especially the case after U.S. banks announced $129 bn in buybacks over the next 4-quarters.
Buybacks, according to BofAML, are on pace for a record at $43B so far this year versus just $75B for the entirety of 2018. This suggests a record of over $1 trillion in S&P 500 buybacks for 2019.
While corporate buybacks remain the key buyer of U.S. equities in 2019, we recognize that corporate insiders have lapsed with their appetite for their stock of late.

While I understand this to be one of the more confounding bull market rallies in recent history, fund flows suggest that the market has room to run higher given how much cash is on the sidelines, awaiting greater certainty with regards to the global economic outlook.
Q2 Earnings Season Is Upon Us
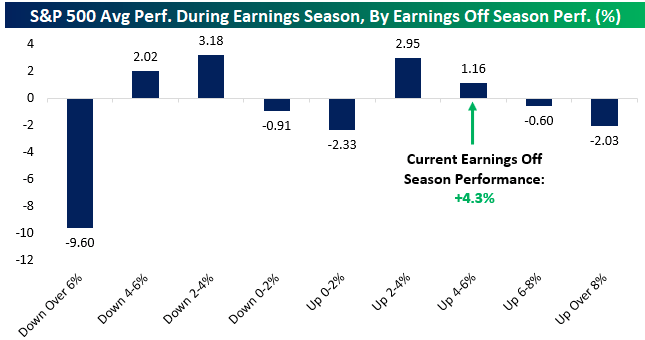
In looking forward to and through earnings season, it’s key to recognize that the market has rallied 4.5% into this coming earning season. Since 2001, stocks tend to perform best over earnings season when they’re either down modestly or up modestly in the prior off-season. Very large or very small off season changes in stock prices tend to lead to the worst earnings season performance, while modest gains or losses in the off season lead to the biggest average gains.
Of course and as I’ve already mentioned, the big money center banks will be reporting earnings this week and after expressing strong stock price appreciation over the last couple of weeks. Citigroup will report on Monday and J.P. Morgan (JPM) and Wells Fargo (WFC) will report on Tuesday.
According to Zack’s Research, total Q2 earnings for the banking industry that includes Citi, JPMorgan, Wells Fargo and other major industry players are expected to be down -5.4% from the same period last year on +0.2% higher revenues. This would follow the +2% earnings growth on +0.8% higher revenues for the group in Q1.
The table below shows Q2 expectations for the constituent industries of the Finance sector, contrasted with what was reported in Q1 and what is expected for Q3. The Major Banks industry represents the biggest slice of the Finance sector, accounting for almost 45% of the sector’s total earnings.

There are more than 140 companies reporting Q2 results this week, including 57 S&P 500 members. While banks and Finance sector companies dominate this week’s reporting docket, there is plenty of representation from other sectors as well, with notable bellwethers like Microsoft (MSFT), Netflix (NFLX), Schlumberger (SLB) also reporting results this week.

Depending on the tracking firm cited, earnings fell in the Q1 period, which is reflected in Zach’s Research chart of earnings below. But here is what they have to offer so far as the Q1 and potential Q2 earnings recession:

“We shouldn’t take this recession talk too seriously, however. The reason is that the negative growth in the first half of the year is solely because of very tough comparisons. In other words, the base period for 2019 Q1 growth is 2018 Q1, when earnings received a huge boost from the tax-cut legislation. The lower corporate tax rates that showed up in earnings for the first time in 2018 Q1, the base year for 2019 Q1, boosted profitability through margin expansion. As such, we are up against some tough comparisons in 2019.”
When I review FactSet’s earnings outlook after a reported -.4% YoY EPS decline in Q1 2019 I come to find that they have indeed lowered their Q2 EPS outlook to express a decline of -3.0% for the reporting period.
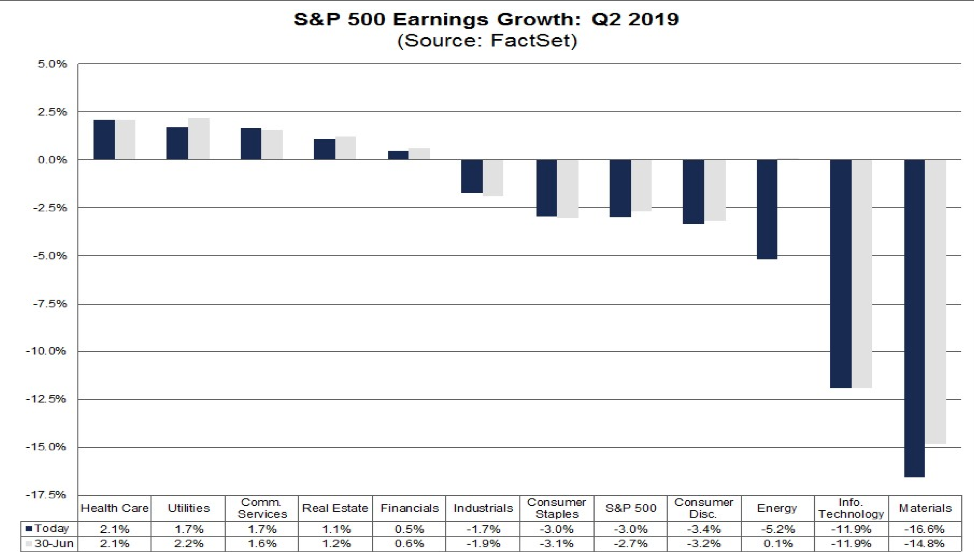
If -3.0% is the actual decline for the quarter, it will mark the first time the index has reported two straight quarters of year-over-year declines in earnings since Q1 2016 and Q2 2016. For Q2 2019 (with 24 of the companies in the S&P 500 reporting actual results for the quarter), 20 companies have reported a positive EPS surprise and 17 companies have reported a positive revenue surprise. The estimated (year-over-year) revenue growth rate for Q2 2019 is 3.7%. If 3.7% is the actual growth rate for the quarter, it will mark the lowest revenue growth rate for the index since Q3 2016 (2.7%). The forward 12-month P/E ratio for the S&P 500 is 17.1. This P/E ratio is above the 5-year average (16.5) and above the 10-year average (14.8).
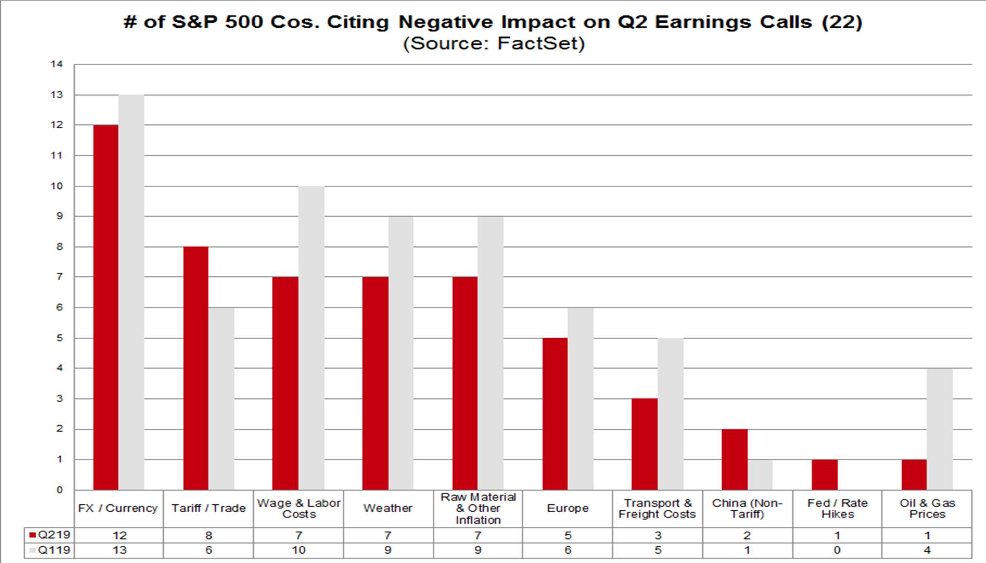
Foreign exchange has again been cited the most on earnings calls to date (12) as a factor that either had a negative impact on earnings or revenues in Q2 or is expected to have a negative impact on earnings and revenues in future quarters. More than half (55%) of the S&P 500 companies that have conducted earnings conference calls to date for the second quarter have cited some negative impact from foreign exchange rates. However, few of these companies discussed specific currencies that had weakened or were expected to weaken against the U.S. dollar. The number of companies citing a negative impact from FX in Q2 (12) is about equal to the number of companies that cited a negative impact from this factor in Q1 (13) at about the same point in time.
After foreign exchange, the factors with the highest number of companies citing a negative impact included tariffs and trade (8), wage and labor costs (7), weather (7), and raw material and other general inflation (7).
- For Q3 2019, analysts are projecting a decline in earnings of -0.8% and revenue growth of 3.3%.
- For Q4 2019, analysts are projecting earnings growth of 6.0% and revenue growth of 4.2%.
- For CY 2019, analysts are projecting earnings growth of 2.4% and revenue growth of 4.3%.
- For Q1 2020, analysts are projecting earnings growth of 9.8% and revenue growth of 5.8%.
- For Q2 2020, analysts are projecting earnings growth of 13.5% and revenue growth of 6.6%.
Last but certainly not least with respect to earnings forecasts for the Q2 2019 period is Lipper/Refinitiv. They are expecting a more modest EPS decline on a YoY basis than what has been offered by FactSet.
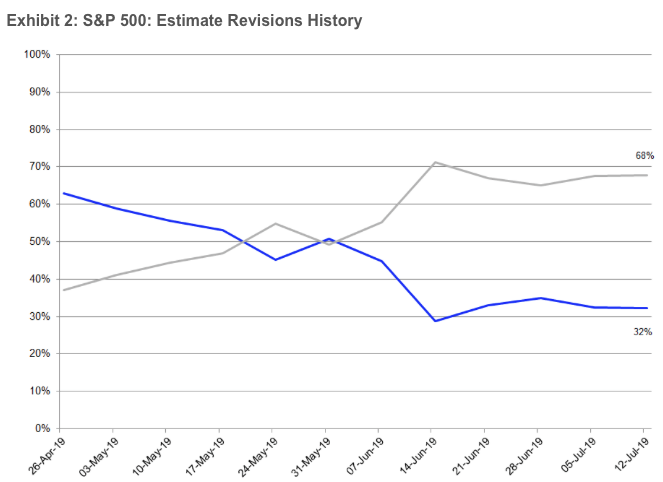
Aggregate Estimates and Revisions:
- Second-quarter earnings are expected to decrease -0.4% from 18Q2. Excluding the energy sector, the earnings growth estimate is 0.0%.
- Of the 24 companies in the S&P 500 that have reported earnings to date for 19Q2, 83.3% have reported earnings above analyst expectations. This compares to a long-term average of 65% and prior four-quarter average of 76%.
- 19Q2 revenue is expected to increase 3.3% from 18Q2. Excluding the energy sector, the growth estimate is 3.9%.
- 75.0% of companies have reported 19Q2 revenue above analyst expectations. This compares to a long-term average of 60% and an average over the past four quarters of 63%.
- For 19Q2, there have been 87 negative EPS preannouncements issued by S&P 500 corporations compared to 23 positive, which results in an N/P ratio of 3.8 for the S&P 500 Index.
- The forward four-quarter (19Q3 –20Q2) P/E ratio for the S&P 500 is 17.2.
Investor Takeaways
I’ve been doing this a long time and it’s not very often that the market expresses an elongated consolidation period/base whereby it then breaks higher and out of that basing period. As such we desire to revisit the chart posted earlier.
Standard technical analysis teaches us that “the bigger the consolidation, the bigger the post-breakout/breakdown move”. Market breadth remains supportive of additional gains, but it does not guarantee those gains or exonerate momentary pullbacks.
“You are not seeing the party hats going on the floor of the New York Stock Exchange,” said JC O’Hara, the chief market technician at MKM Partners. “The average investor has a healthy degree of skepticism. They are very aware of the signs that an economic slowdown is taking place. But in a TINA market, where are they going to put their money?”
Heading into earnings seasons and with the belief that central banks will become more accommodative near-term, the markets may becoming overly focused on central banks and failing to see the forest for the trees. Earnings are the mother’s milk of the market and losing sight of earnings in favor of the central bank narrative can prove a dangerous concoction for one’s invested capital. While the Fed put or central bank accommodations can prove to backstop the market and general financial conditions, it shouldn’t guide your overall market participation.
In this era of central banks’ involvement in the economy and markets, we simply do not know how effective their policies can or will be going forward. We should ask ourselves whether or not central bank policy has reached the extent of its ability to support the economy and markets. In my view, many investors have become too reliant on expectations that global central bankers, including those from Europe and Asia, will stimulate their respective economies to forestall further weakness. With this in mind, I think it’s best for investors to remain cautious but active, nimble but with sound investing principles.


