
7 Weeks After 1600-Plus Breakout, Russell 2K Trying To Force Another Breakout
Once again, small-caps are at a crucial juncture. The Russell 2000 slightly retreated three weeks ago after rallying hard post-1600+ breakout. Wednesday, bulls rallied past that high, but barely. A convincing takeout of this level brings the index one step closer to testing its all-time high from August 2018.
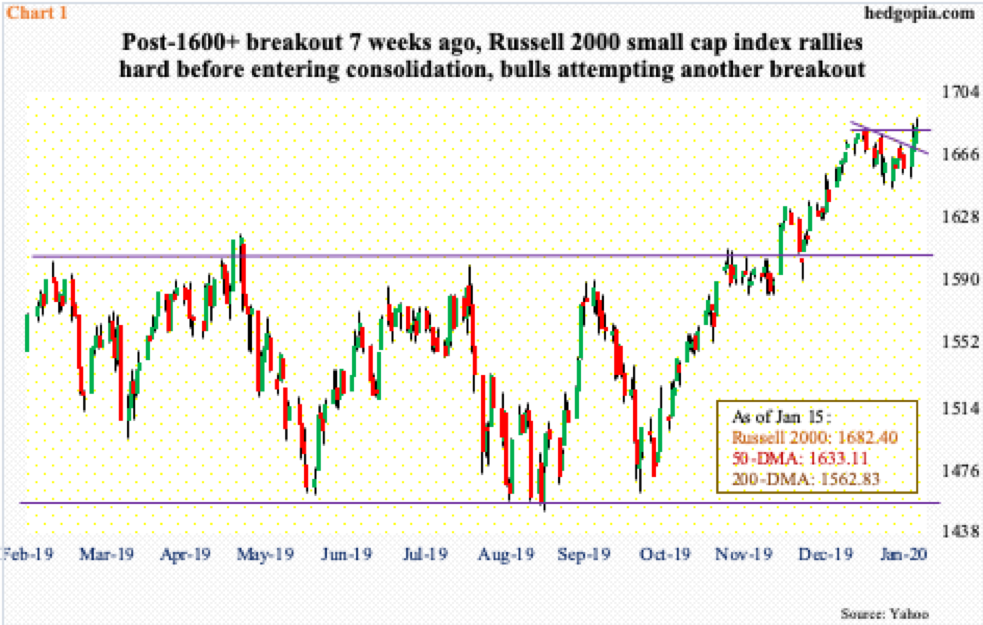
On December 27, the Russell 2000 small cap index (1682.40) made an intraday high of 1681.68 before retreating. Wednesday, small-cap bulls broke through that level, albeit barely. This preceded a one-month sharp rally after breaking out of major resistance just north of 1600 seven weeks ago (Chart 1).
With two sessions to go this week, the index is up 1.5 percent. Before this, it suffered three weekly declines in a row after the post-Christmas high. A convincing breakout can add to bulls’ momentum. This will put them one step closer to testing the all-time high of 1742.09 from August 2018.
Several times since May/June last year, bulls stepped up in defense of 1450s. Then came the 1600+ breakout late November. Using a measured price objective technique, breakout traders are probably eyeing that August 2018 high.
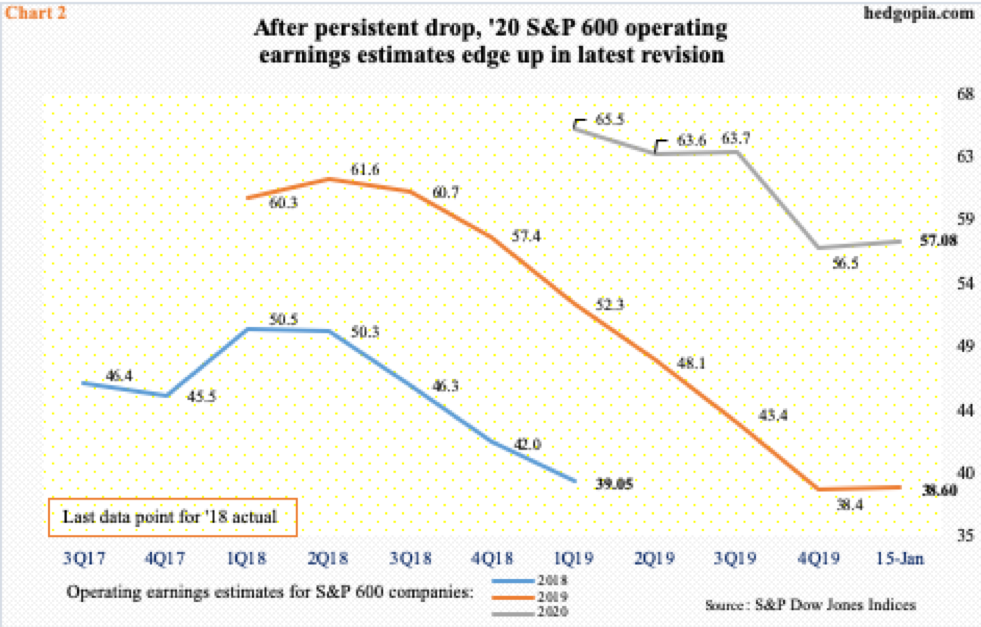
The improved price action comes in a week in which 2020 operating earnings estimates for S&P 600 small-cap companies inched up. As of Wednesday, the sell-side penciled in $57.08, up from $56.49 at the end of last year. With 4Q earnings seasons just underway, estimates for this year edged up as well – from $38.42 to $38.60.
Markets at this point in time obviously remain focused on 2020 estimates. In February last year, the sell-side expected $67.63, which was then persistently revised downward – until this week (Chart 2). We need at least a few more weeks’ data to figure out if this is the bottom in the hitherto downward revision trend.
Markets seem to want to give optimism the benefit of the doubt. Hence how the Russell 2000 is behaving this week.
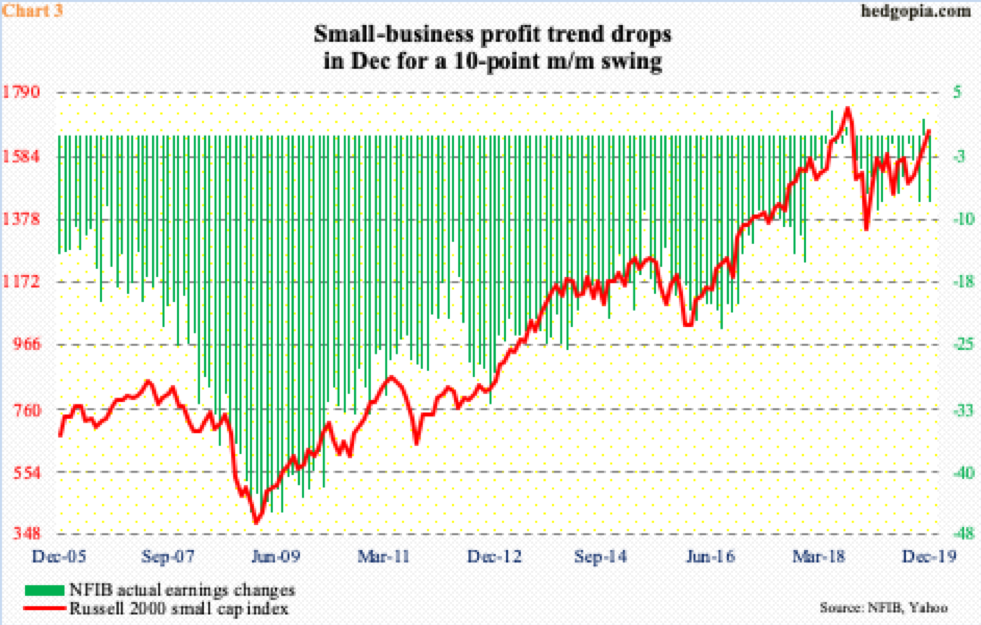
Also Tuesday this week, the NFIB (National Federation of Independent Business) published its monthly survey of small businesses for December. And the news was not encouraging in terms of how these companies viewed their profit trend. The ‘actual earnings changes’ sub-index dropped to minus eight for a net swing of 10, to match the low of October as well as March last year (Chart 3).
That said, the fact remains that small businesses’ profits witnessed massive improvement post-Great Recession. The Russell 2000 followed along. Even here, despite the December drop, the green bars in the chart remain near the highs. But it is the trend that counts. Continued deterioration can change the profit outlook, which then gets reflected in Chart 2 and then on to Chart 1.
Hence the significance of how the Russell 2000 behaves in the next several sessions.


