
2018 Market Volatility And Volatility Trading Update
Investor Sentiment
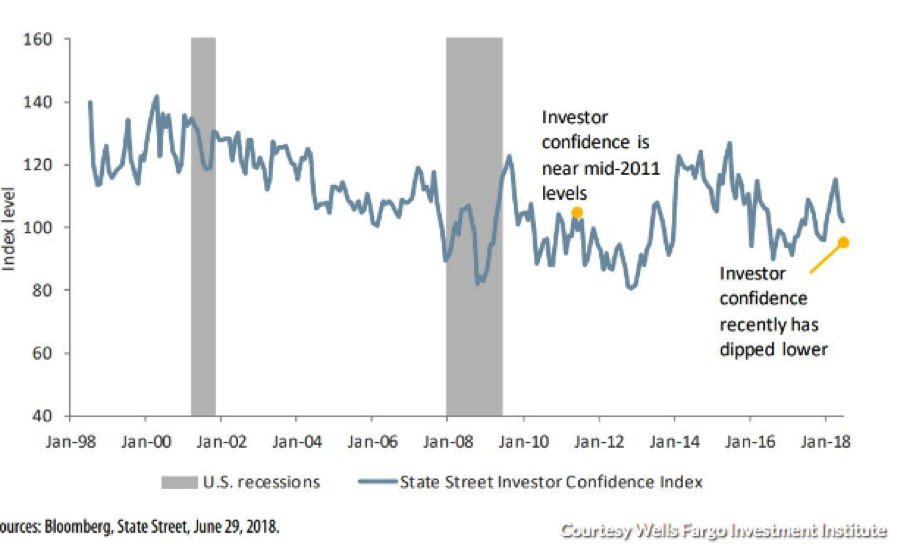
This year has been a year unlike more recent and years whereby the markets trended steadily higher and were somewhat predictable. No, 2018 has been found with lesser investor confidence and enthusiasm post the January period where the tax cuts/fiscal stimulus was otherwise priced into the market. A recent read on institutional-investor confidence has come down sharply this year, according to the Wells Fargo Investment Institute, a change largely to the trade related tensions between the U.S. and the world.
According to the AAII Investor Sentiment survey (July 6), the percentage of investors who describe themselves as bullish, meaning they expect stocks to be higher in six months, fell to a three-month low in the latest week. Only 27.9% of those polled are optimistic, well below the 38.5% historical average, and at a level that AAII described as “unusually low,” meaning it is one standard deviation below the long-term average.
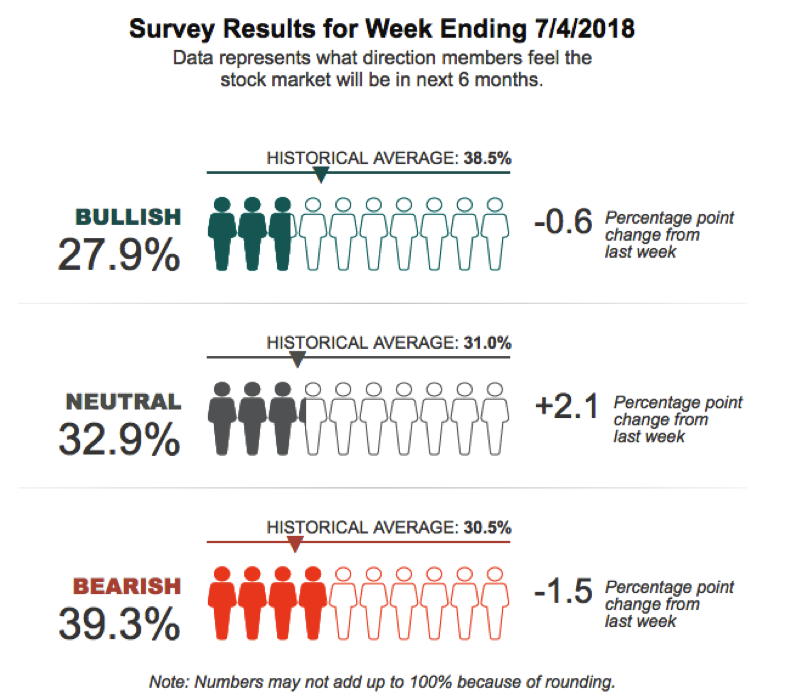
The ratio of bearish investors stands at 39.3%, notably above the long-term average of 30.5%, but down 1.5 percentage points from the previous week, when it was at an unusually high level. Nearly 33% of investors describe themselves as neutral on the market; this reading has been above the historical average of 31% for 20 straight weeks, a sign of how mixed investors are about Wall Street’s prospects over the rest of 2018. Fortunately, the most recent AAII Investment Sentiment survey showed marked improvement from the July 6th reading.
So here’s the point with regards to investor sentiment: There’s less confidence in equity prices moving higher. Conversely, the indicators or readings on investor confidence are often used as contrarian indicators. In other words, one might consider buying when confidence is low and selling when confidence is high.
Headwinds vs. Tailwinds
More importantly as it pertains to 2018, the lack of investor confidence is indicative of the markets inability to break to the downside or the upside as investors continue to weigh the pros and cons. And there are a great many pros and cons that are offsetting in 2018. Take a look at the following table of pros and cons presented by Charles Schwab that identifies the headwinds and tailwinds for market participants.
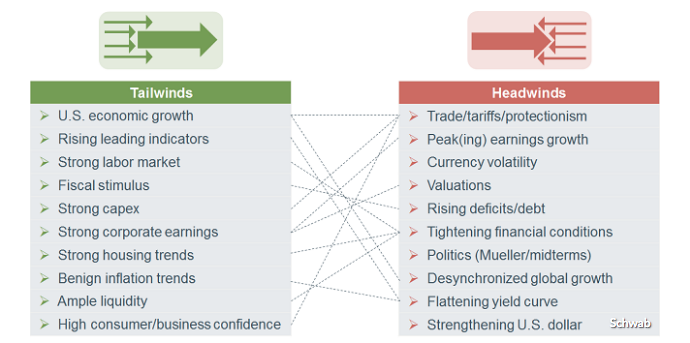
That’s why it has been so difficult for the market to gain traction and why the markets have been stuck in a range for the better part of the last 4 months. At some point, the market will make a decision, for better or worse.
Moreover, the market has found itself with increased volatility for the aforementioned reasons and variables. Where 2017 found the average VIX reading at just above 11%, 2018 has found the VIX some 35-40% higher than the prior year. The median VIX in 2018 thus far is 15.78% and the highest median value since 2012 where the median VIX reading was17.52.
2018 Volatility Trading
Before we begin discussing trading volatility, here are some important basic fundamentals and principles about the VIX.
- The VIX is priced from a portfolio of S&P 500 (SPX) options defined by the CBOE, and the futures price from the market’s expectation (Implied Volatility) of where the VIX Index will settle at expiration. One component in the price of SPX options is an estimate of how volatile the S&P 500 will be between now and the option’s expiration date.
- This estimate is not directly stated, but is implied in how much buyers are willing to pay.If the market has been expressing great gyrations, option premiums will be expensive. To the contrary, in a quiet market they will be cheaper.
- The moves of the VIX track prices on the SPX options market, not the general stock market; this is a key point.The SPX options market is large, with a notional value greater than $100 billion, and is dominated by institutional investors. A single SPX put or call option has the leverage of around $200K in stock value, too big for most retail or independent investors.
- The VIX Index, often referred to as “spot VIX”, is simply the implied 30-day volatility of S&P 500 options. To calculate 30-day implied volatility of S&P 500 options, a weighted average of implied volatility across a range of puts and calls (strangle) is taken such that the resulting weighted average represents synthetic 30-day implied volatility.
Golden Capital Portfolio (which I manage, at Finom Group) is focused on a VIX investment strategy and has been since 2012. In 2018, given the longevity of the current economic cycle (expansion) and relative complacency in the markets found in 2017, it was expected that market volatility would elevate. I warned investors in 2017 with the publication titled Short Volatility Strategies And A Word Of Caution. In it, I warn of the usage for certain VIX-ETPs, notably SVXY and XIV. Unfortunately, the warnings proved all-too prescient.
Additionally, every year, volatility is expressed uniquely in the market. For example: 2017 was a short-every-VOL-spike-to-death year for volatility, no matter how big or how small. And that’s exactly how the year played out. In general, shorting VIX spikes go hand-in-hand with the efficient market hypothesis even though it’s never considered to be. In fact, this might be the first publication offering such a VIX correlation to the efficient market hypothesis.
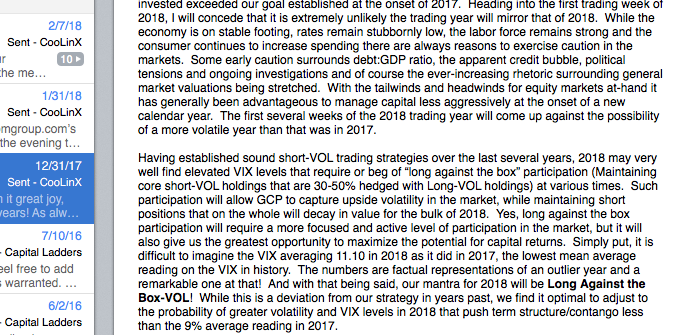
In 2018, we characterized and forecasted for higher volatility in the markets. In an e-mail to Golden Capital Portfolio investors we named 2018 VOL trading long-against-the-box or LOB. The following screenshot is from the Golden Capital Portfolio annual letter to investors that detail thoughts on VOL trading in 2018.
Higher Volatility Regime
There is a difference between elevated volatility in the markets and volatility remaining elevated. Unfortunately, the media and mass investor population overlooks the distinction. Volatility or the VIX can be elevated versus the previous year, but still hold true to its nature, which is to rise for brief periods of time and fall for longer periods of time. 2018 is a perfect example of this explanation whereby the VIX rose sharply in February and has remained higher on average when compared to 2017, but still trending lower since February.
So what does that mean for volatility traders and the short-VOL trade given that volatility has elevated in 2018? What we decided at the end of 2017 was that it would probably be advantageous to forgo the usage of 2X-leveraged VIX-Exchange Traded Products. In 2018, Golden Capital Portfolio transitioned most holdings from UVXY to VXX. The VXX product is not leveraged like UVXY and as such, should a VIX event occur as it did in February, the drawdown on holdings would not be significant. The plan worked rather well given the February “Volpocolypse”, as it’s now referred.
Trading volatility requires or demands vast experience in the market, a fundamental dedication to macroeconomics, following earnings cycles and more. In short, trading volatility shouldn’t be viewed as a part-time job if that is in fact a main strategy one employs for investing and trading purposes. For those who do not have the time or ability to dedicate such time, but still desire to achieve outsized returns from the trade, mentors are available and can lend expertise to curtail time allocations.
Given the Volpocolypse that occurred in February and resulting in the termination of XIV and lowered leverage for several other VIX-ETPs, what’s next for trading volatility? That’s where market experience comes into play. Yes, we are likely in the latter innings of the bull market and economic expansion, but that does not mean markets will begin to falter or volatility will remain elevated. And even if markets falter and volatility rises for brief time periods so what. Why “so what”?
Let’s face it, recessions, bear markets and even corrections are very brief when compared to economic expansions and bull markets. In fact, expansions and bull markets are often triple and even quadruple the duration of the former conditions. So what is the job of a short-VOL trader and/or investor? That’s right; simply maintain liquidity to preside over the duration of the trade. It’s only a matter of time when shorting volatility. Time can be measured in terms of cash liquidity in ones brokerage account.
Additionally, while markets can trend lower, the VIX correlation to the market is not a perfect 1:1 correlation. Markets can decline with the VIX also declining and visa versa. The fact of the matter is that the market can’t sustain a constant elevated reading of volatility or "elevatING" of volatility, as investors would simply leave the market in droves. We have seen this for decades and most recently in the February 2018 period where the VIX briefly touched 50 before faltering, even as the market trended lower. The VIX fell quite substantially as the market dipped further and only sustained itself above the 20% level for less than 4 weeks before falling below this historical median average of the VIX (19%-20%). It's also important to note that the historic average VIX reading is not without extrapolating for major spikes like that of 2008, 2011, 2014, 2015 and 2018. If we do extrapolate these spikes of significance, the true average is much less than 19-20% and probably closer to 12-14 percent,.
Moreover, the VIX is often found as a hedging instrument as institutional investors seek to offset declines in the equity market commonly associated with elevating volatility/VIX levels. But there is a point when such a hedge becomes too expensive in terms of risk/reward provided through the VIX hedge (Volatilty Risk Premium). Generally, the VIX doesn’t maintain itself above or in the mid-20s for very long as this is considered an expensive level to hedge within the VIX complex. As such, even though the market (S&P 500) may still be declining, the absence of hedging through .SPX options expresses a declining value in the VIX. Subsequently as the VIX declines, derivatives (VIX options, futures, VIX-ETPs) within the complex also lose value or decay in price.
Actively Trading VIX-Exchange Trade Products
More importantly, as it pertains to trading volatility, are the products one uses to trade volatility. Inverse VIX-ETPs, those that trade inversely to the VIX itself (VIX goes up, VXX, UVXY, TVIX, VIXY go down/decay) will decay in value over time. Such decay is based on the ETP’s correlations and composition of VIX futures as well as the general understanding that public equity markets will always exist. Based on the decay factor, these instruments are used directly in short participation and theory as to shorting volatility. One can use options, buy puts in certain of these products, but it’s likely more advantageous to sell calls and avoid what can occur with VIX-ETPs and is known as “theta decay”.
Options are a way to manage risk in the volatility complex, although it does come with other debatable risks such as post and premarket hour trading risks. Obviously, one cannot trade option positions during premarket and post market-trading hours. Unfortunately, many market related events can and do take place during such hours that leave a trader lacking for risk mitigation from either side of the trade. Remember, if the job of the trader is to maintain liquidity, but certain market events during untradeable hours expose an option to be put or called at max loss/risk exposure, the liquidity aspect of the trade can be nullified greatly (and where will the option be put or called away is an unknown aspect leaving a trader without being able to fully define account liquidity). It’s just one of the many reasons Golden Capital Portfolio prefers the usage of common shares despite where the greater trading takes place, in the options market. Having said that, it may also identify one of the underlying reasons Golden Capital Portfolio has managed well through the various VIX events over the years. Moving on…
Contango and Backwardation
For those new to trading volatility, understanding term structure is of critical importance as it can point to the current and implied state of market volatility out 8 months. Vixcentral.com is a useful resource for studying term structure and aspects of contango and backwardation. The state of term structure is found in contango more than 85% of the time. Below is a screenshot of Finomgroup.com’s 4-part VIX course slide that identifies the history of contango vs. backwardation.
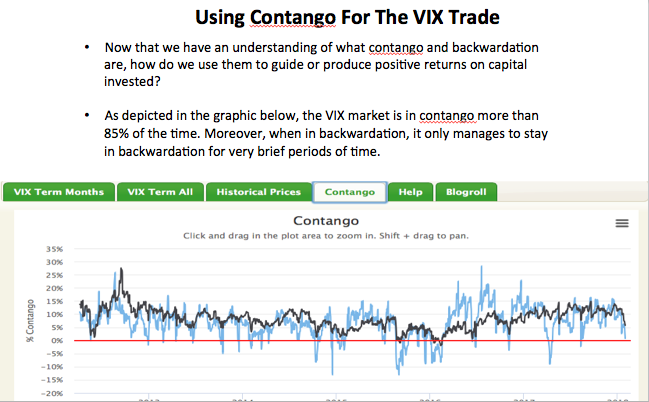
- When a market is "in contango," it describes a situation in which the delivery price of a particular futures contract has to converge downward to meet the spot price. A market that is in contango indicates that the forward or futures curve is upward sloping. If prices did not converge, it would set up an opportunity for investors to profit from arbitrage. Contango situations can be costly to investors holding net long positions since futures prices are falling. We typically suggest that when contango is present, there is a headwind for long VXX/UVXY holdings.
- Backwardation does not occur frequently in the Volatility complex based on the natural order of market cyclicality being more predisposed to bullishness than bearishness. When the Spot Price/VIX of the underlying is greater than the futures price at a particular point in time, the situation is called “backwardation”. When VIX futures are in backwardation, the futures price moves higher to converge with the Spot Price in backwardation and as the futures contract approaches expiration. We typically suggest that when backwardation is present, there is a tailwind for long VXX/UVXY holdings.
The following image shows both conditions of the VIX futures curve or term structure. While the curve is upward sloping, denoting contango, the front two-month futures contracts are in backwardation.
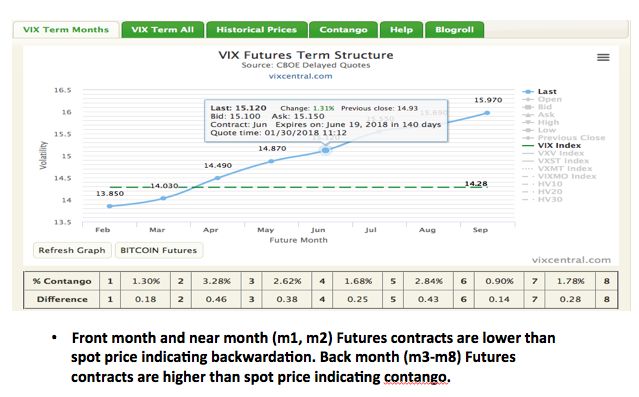
As noted earlier, 2018 has been found with elevated levels of volatility when compared to 2017. Given such a dynamic, backwardation has also been more prevalent in term structure. Contango represents the implied stability in the marketplace, or complacency. Backwardation tends to represent rising volatility and greater fear in the marketplace.
Fed Tightening and Volatility
In speaking of 2018 and market experience, how does Fed-tightening factor into the equation? That’s a very good question, a very good question indeed. As we consider Fed tightening through the prism of the yield curve we’re forced to accept and understand that, well this is a time where experience may be helpful but a guide it may not prove to be. Why? Well because there has never been such a tightening cycle coinciding with such fiscal stimulus in the means of tax reform, or for that matter following such a long cycle of quantitative easing. These are new issues and experiences the market is and will contend with going forward. Emerging markets are presently feeling the brunt of U.S. central bank tightening and decoupling economic growth prospects. Central bank tightening has already served to impact investor sentiment as we noted earlier as well. As such, forecasting volatility may require more erring on the side of caution rather than sticking to hard and fast notions of predictions and modeling.
Nonetheless, modeling is not without its merits in both form and function. Take a look at the recent model produced by Topdown Charts:
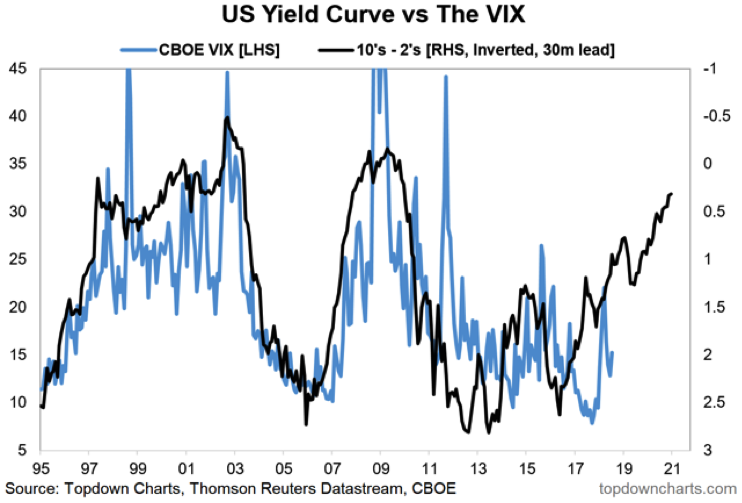
“The chart comes from a report on the yield curve outlook and the implications for risk assets. Basically, our analysis shows that this flattening of the yield curve will not slow down any time soon, and if anything, we expect the yield curve to fully invert within the next 6-12 months.
At the long end of the curve, bond market participants are constantly discounting information and expectations about future growth and inflation. As you get closer to the end of the business cycle, naturally this would mean that 10-year bond yields would start to top out or even fall as bond traders anticipated softer data ahead, thereby driving flattening by keeping 10-year bond yields constant if not pushing them lower.
So on the back of this chart, it's entirely reasonable to expect volatility to be generally higher and to trend upward over the next couple of years.”
While the exercise and provided chart are offered in modeling future potential for both the spreads and VIX, it has it’s shortcomings and it’s probably more optimal to model the flatness of the curve than perform a comparative analysis and projecting onto the VIX.
Bottom line is that most late inning expansion cycles are comprised of higher volatility levels. As such a short-VOL trader will find it increasingly more necessary to monitor aspects of liquidity in the trade and likely take smaller bites in favor of maintaining longevity in the trade. For example: Let us say we can see into the future and we see that the VIX will average 17% in 2019. This is possible and has a greater probability given the aforementioned factors consistent with a late inning market cycle. Does that mean the VIX will be between 19% and 15% for the duration of 2019? Certainly not. There will likely be periods above 20% and below 14%, but it’s within these ranges that volatility traders will need to make decisions on shorting, taking profits, deleveraging and standing by while things essentially play out. This is where mentors can come in quite handy.
For 2018, however, we do see the current median range of 15+ percent being exactly what we’ve expected to see and as Finom Group has written about in previous reports.
"Finom Group expects a median VIX reading of 15.70 for the VIX in 2018, +/- .50 percent. Review the table of Median daily VIX prices below."
We also foresee future bouts of volatility in the coming months that will plunge the VIX below 11% and take it above 22%, even if ever so briefly. Our forecast expresses such wild swings due to what we’ve already telegraphed within this article and the unmentioned election cycle. Nonetheless, we continue to hold a core VXX position worth 16.5% of Golden Capital Portfolio holdings, hedged directly with cash holdings in excess of 40 percent.
2018 will prove to be an interesting and volatile year for the markets. While bear market participants have fanned the flame or beaten the drum for a market crash to ensue throughout the first 6 months of the year, such an event is highly unlikely absent a black swan type variable being introduced to the market. Before I highlight one bear market promoted call from earlier this year, I want to also offer that markets following earnings. This is inarguable as proven with a S&P 500 historic earnings chart layover with the S&P 500 itself. As Larry Kudlow often says, "Earnings are the Mother's milk of markets". In other words, as earnings go, markets follow over time. Now let's move on to that bear market call from earlier this year. Recall this nonsense! I call it nonsense because it is just that, nonsense.
McClellan, publisher of the McClellan Market Report, said there could be a pause in the downtrend this week, as his market-timing signals point to a minor top due on Friday. But with his “price oscillator” turning lower following the Dow Jones Industrial Average’s 425-point drop, and the S&P 500 index’s 1.3% slide on Tuesday, he turned bearish for short- and intermediate-term trading styles. He has been bearish for long-term trading styles since Feb. 28.
“I have been looking for a big downturn in late April....We appear to have gotten that downturn now,” McClellan wrote in a note to clients. He said it is possible that the big down move pauses briefly in honor of the minor top signal due Friday, “but it should be a lasting and painful downtrend, heading down toward a bottom due in late August.”
“Turning down a Price Oscillator while it is still below zero conveys the promise of a lower closing low on the ensuing move,” McClellan wrote.
Since “promise” isn’t the same as a “guarantee,” he said the indication can get revoked if the Price Oscillator turns up right away. “I do not expect that outcome this time, but I acknowledge it is a possibility,” McClellan said.
The call was made in the final week of April. Only a week after the famous McClellan Oscillator signaled a bear market that would find a bottom in August, the market began its uptrend. Undoubtedly, coinciding with the heightened levels of market volatility and market declines from the February-April periods that were based on, well fear, Tom McClellan made an error in forecasting. His forecast was not based solely on the McClellan Oscillator, but if you're unable to derive a more probable forecast on your own technical indicator then...you get my point! The fundamental point I'm trying to example within the context of the erroneous call by Tom McClellan is that technical indicators can often be found with great error as they discount the value of earnings in the market. Markets follow earnings over time. The market may have gyrations that cause fear and waning sentiment amongst investors, but over time the market will revert to the direction of earnings for better or for worse. Markets do not function to the contrary over time.
At Finom Group we offer daily insights and trading opportunities surrounding aspects of volatility in the market. Our track record is embarrassingly strong and supported with expertise. Presented ...
more

