
2 Biopharma Stocks Looking To Make A Difference Against COVID-19: Technical Levels To Watch

Shares of Ocugen Inc. (OCGN) and Vaxart Inc. (VXRT) are moving Monday, May 3. Ocugen shares gapped higher after the company's studies showed that COVAXIN is potentially effective against three key variants of SARS-CoV-2. Vaxart shares were getting hammered Monday morning after the company reported disappointing first-quarter EPS and sales results.
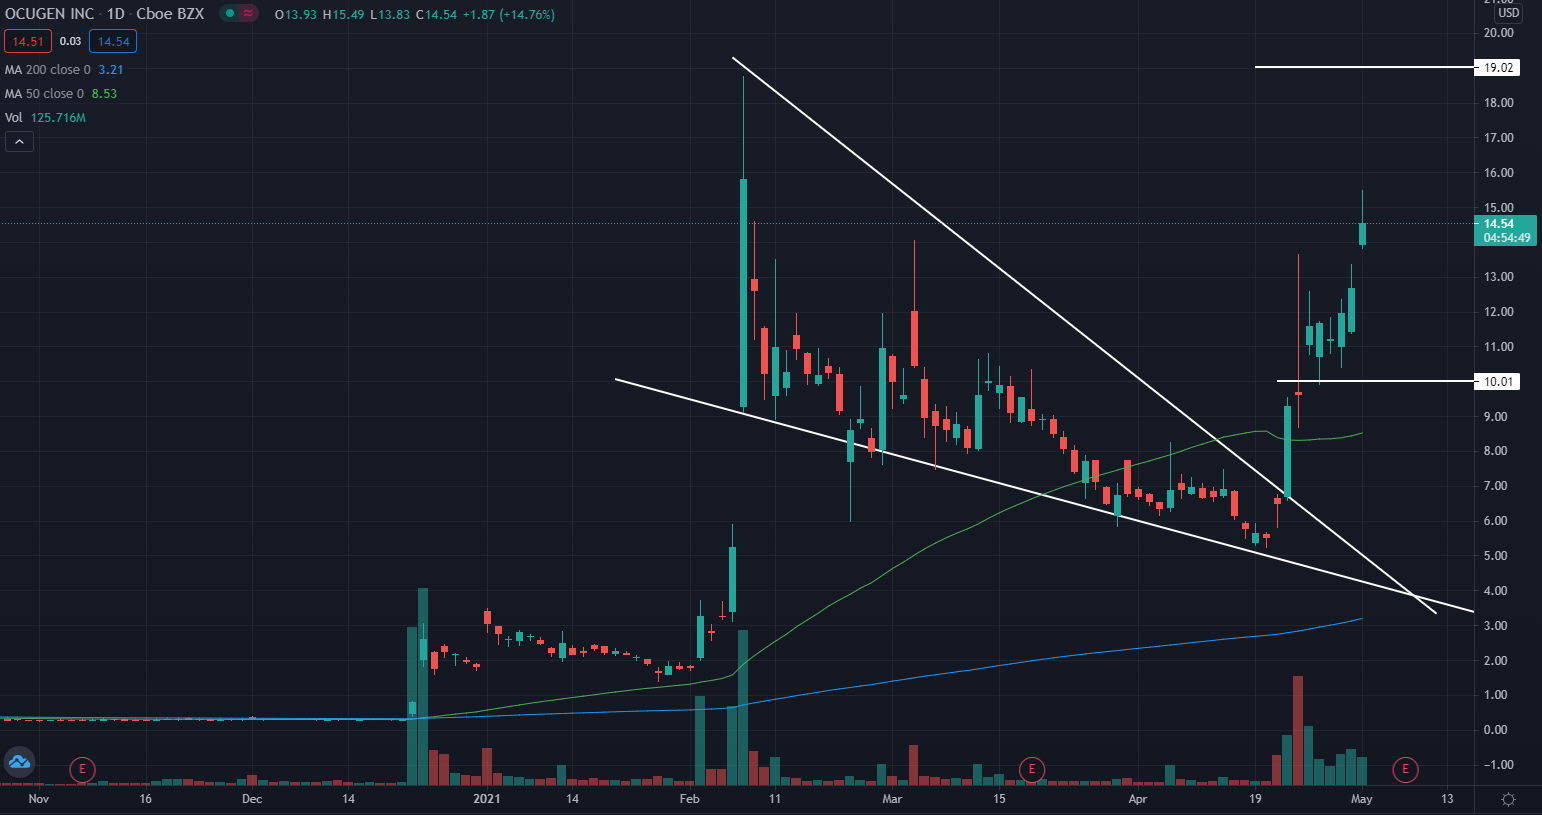
Ocugen Daily Chart Analysis
Ocugen broke out of what technical traders call a falling wedge pattern. The stock was able to find some support at a higher level following the breakout.
The stock is trading above both the 50-day moving average (green) as well as the 200-day moving average (blue), indicating sentiment in the stock has been bullish. These moving averages may both hold as support levels in the future.
Key Ocugen Levels To Watch
- The stock was falling the past couple months forming a falling wedge pattern before the stock was able to break out and move higher.
- The stock moved higher and consolidated near the $10 level before it started pushing higher again. This $10 level may now hold as support again in the future.
- The high of the year is up near the $19 level, and this area may hold as resistance if the price is able to climb back to this level.
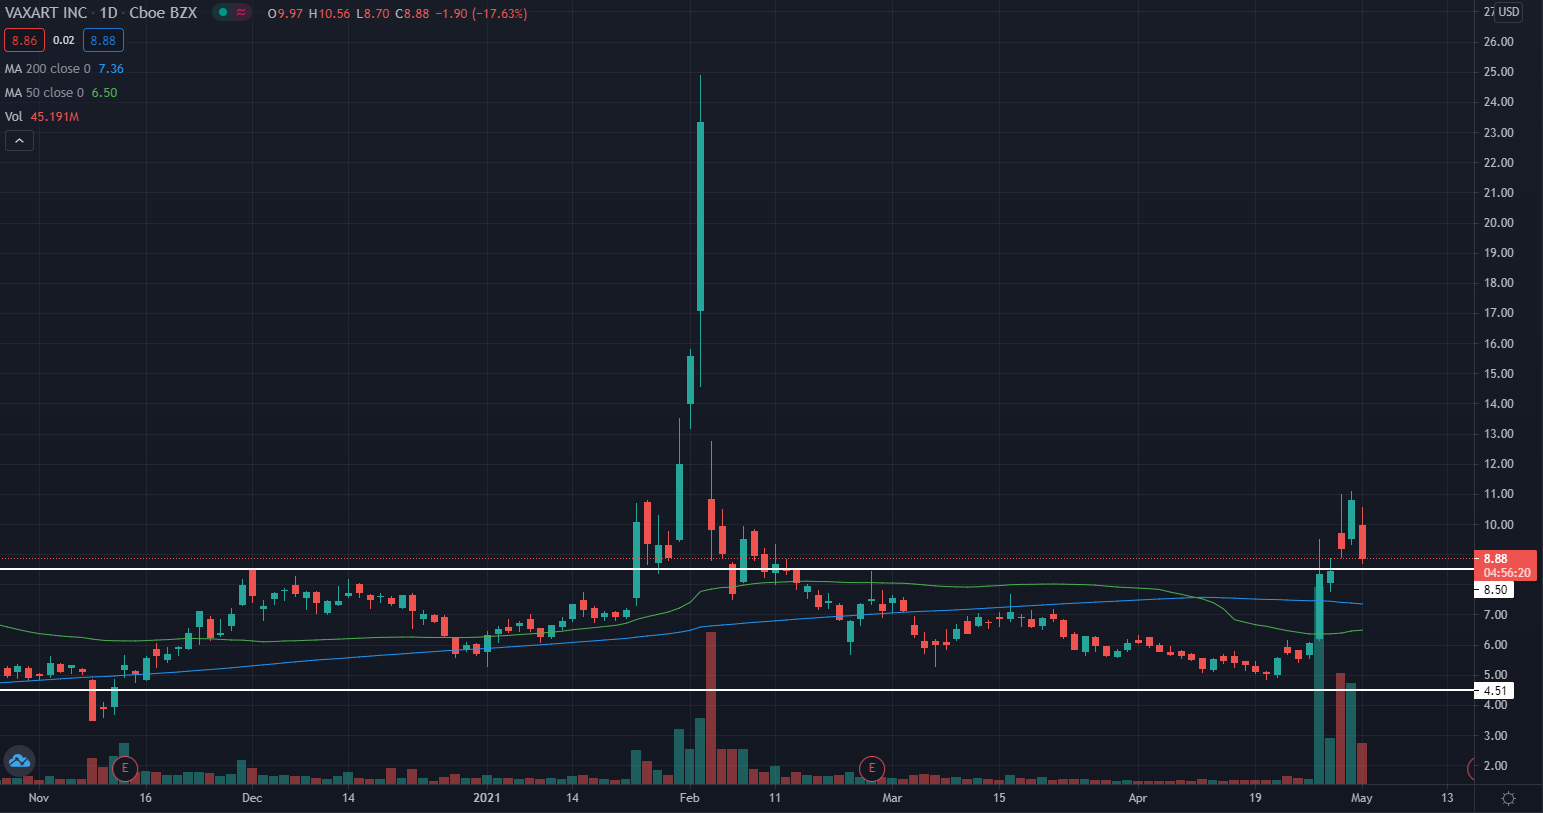
Vaxart Daily Chart Analysis
Vaxart was trading in a channel and broke out of potential resistance, the stock is now looking to find support at this old resistance level before potentially pushing higher.
The stock is trading above both the 50-day moving average (green) as well as the 200-day moving average (blue). This indicates the sentiment of the stock is most likely bullish. The moving averages are areas on the chart that may hold a support level unless the price makes a strong downward move.
Key Vaxart Levels To Watch
- The stock was trading sideways in a channel in the last two months before breaking above resistance and is now looking to test this old resistance as support.
- The stock has previously shown resistance near the $8.50 level.
- The $4.50 level is an area on the chart where the stock has always been able to find support. The stock showing it has been able to hold this level before hints to traders that it may be able to find support here again.
© 2021 Benzinga.com. Benzinga does not provide investment advice. All rights reserved.


