
14 Months, 8 Months, 16 Months
That’s the amount of time between 10 year-3 month yield curve inversions and the beginning of the subsequent NBER-dated recession (these are the three recessions in the Great Moderation period). This is shown in Figure 1.
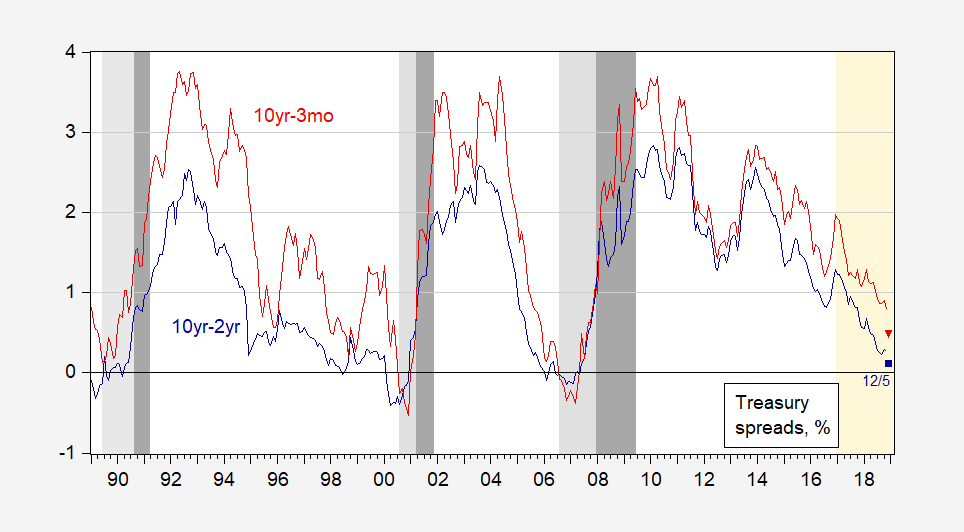
Figure 1: 10 year-3 month Treasury yield spread (red), and 10 year-2 year spread (blue), %. December observations are for 12/5. NBER dated recessions shaded dark gray. Light shading denotes beginning of inversions of the 10yr-3mo spread onward. Source: FRED, Bloomberg, NBER, and author’s calculations.
It looks like we are on pace for the 10yr-2yr inversion I predicted in this post. For the 10 year-2 year spread, the corresponding numbers are 19, 13, 22 months.
Interestingly, the 10yr-3mo spread did not actually invert before the 1990-91 recession (the gray shading starts from the minimum, in 1989M06).
More formal econometric evidence on spreads and recessions, see Chinn-Kucko.
Update, 12/6 7:30PM Pacific: The Richmond Fed questions the conventional wisdom, focusing on the downward trend in the estimated term premium:
The recent flattening of the yield curve has raised concerns that a recession is around the corner. Such concerns stem partly from the fact that yield curve inversions have preceded each of the past seven recessions. However, other factors affect the yield curve’s shape besides the expected future health of the economy. In particular, a low term premium — as has been observed in recent years — makes yield curve inversions more likely even if the risk of recession has not increased at all.
Disclosure: None.


