
10 Exceptionally High Total Return Dividend Stocks

Image Source: Unsplash
Income investors typically buy dividend stocks for income right now, as well as rising income over time. Indeed, this is why we often recommend dividend growth stocks such as the Dividend Aristocrats, a group of 65 stocks in the S&P 500 Index with 25+ consecutive years of dividend growth.
At the same time, dividends are not the only consideration. Investors should also consider stocks with high total return potential.
Buying dividend stocks can generate strong returns while buying dividend stocks when they are also undervalued, can be even better.
This article will discuss the top 10 ranked stocks in the Sure Analysis Research Database (excluding REITs, MLPs, and BDCs) that pay dividends to shareholders. The stocks are ranked by expected total returns over the next five years.
#10: Star Bulk Carriers Corp. (SBLK)
- Expected annual returns: 21.3%
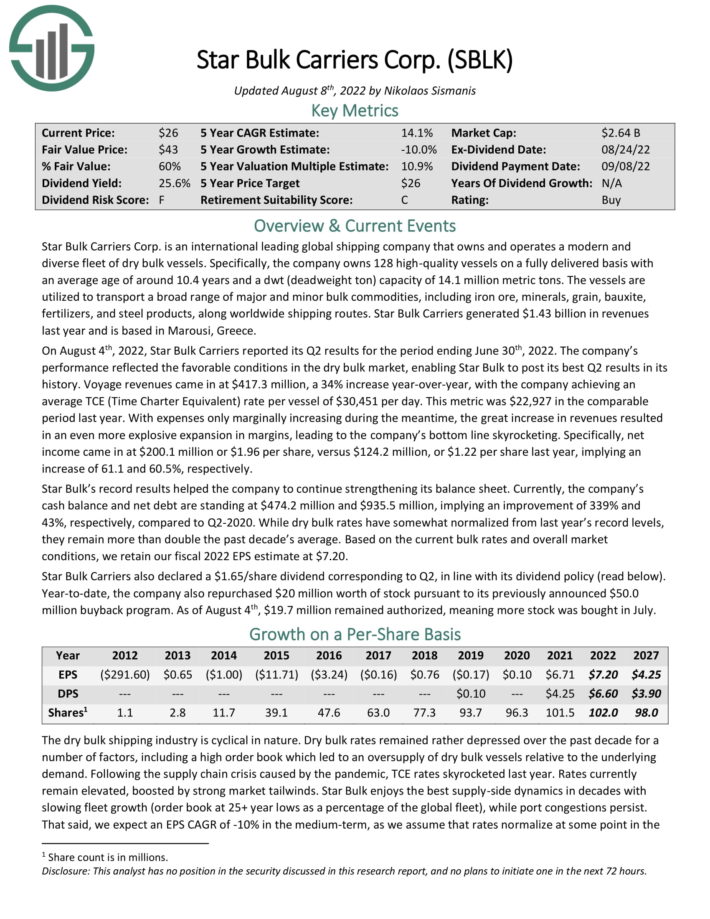
Star Bulk Carriers Corp. is an international leading global shipping company that owns and operates a modern and diverse fleet of dry bulk vessels. Specifically, the company owns 128 high-quality vessels on a fully delivered basis with an average age of around 10.4 years and a dwt (deadweight ton) capacity of 14.1 million metric tons.
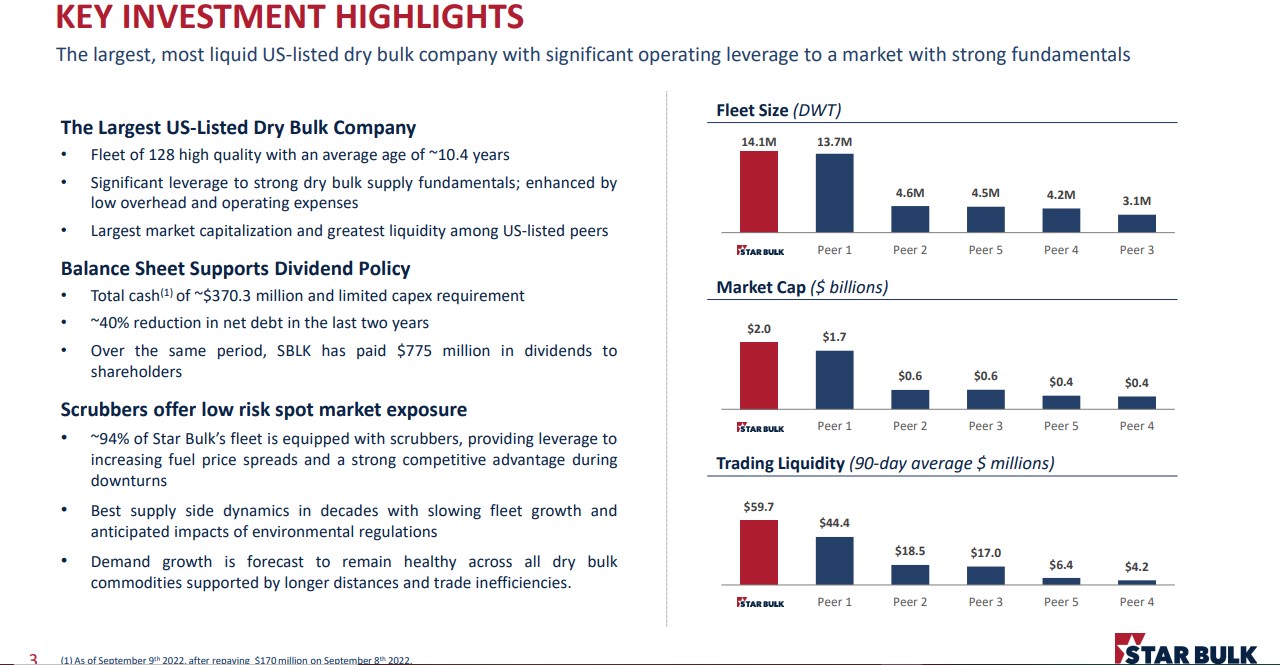
Source: Investor Presentation
The vessels are utilized to transport a broad range of major and minor bulk commodities, including iron ore, minerals, grain, bauxite, fertilizers, and steel products, along worldwide shipping routes. Star Bulk Carriers generated $1.43 billion in revenues last year and are based in Marousi, Greece.
On August 4th, 2022, Star Bulk Carriers reported its Q2 results for the period ending June 30th, 2022. The company’s performance reflected the favorable conditions in the dry bulk market, enabling Star Bulk to post its best Q2 results in its history.
Voyage revenues came in at $417.3 million, a 34% increase year-over-year, with the company achieving an average TCE (Time Charter Equivalent) rate per vessel of $30,451 per day. This metric was $22,927 in the comparable period last year. With expenses only marginally increasing during the meantime, the great increase in revenues resulted in an even more explosive expansion in margins, leading to the company’s bottom line skyrocketing.
Specifically, net income came in at $200.1 million, or $1.96 per share, versus $124.2 million, or $1.22 per share last year, implying an increase of 61.1 and 60.5%, respectively.
Click here to download our most recent Sure Analysis report on SBLK (preview of page 1 of 3 shown below):
#9: Comcast Corp. (CMCSA)
- Expected annual returns: 21.7%
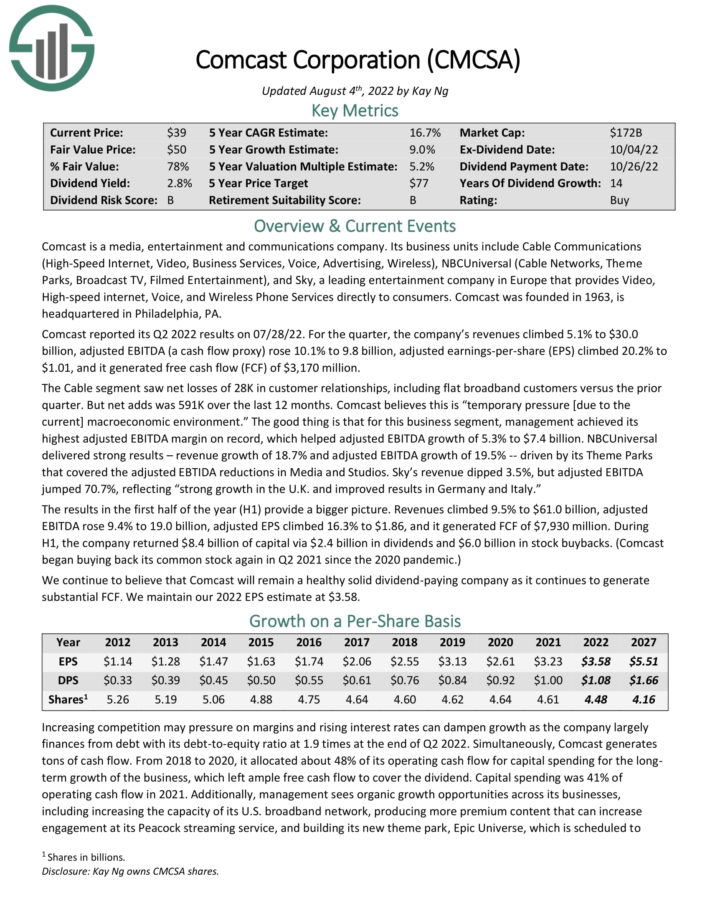
Comcast is a media, entertainment, and communications company. Its business units include Cable Communications (High-Speed Internet, Video, Business Services, Voice, Advertising, Wireless), NBCUniversal (Cable Networks, Theme Parks, Broadcast TV, Filmed Entertainment), and Sky, a leading entertainment company in Europe that provides Video, High-speed internet, Voice, and Wireless Phone Services directly to consumers.
Comcast reported its Q3 2022 results on 10/27/22. For the quarter, the revenue of $29.85 billion declined 1.5% year-over-year but beat estimates by $120 million. Adjusted earnings-per-share of $0.96 beat estimates by $0.06.
You can see a breakdown of the financial highlights in the below image:
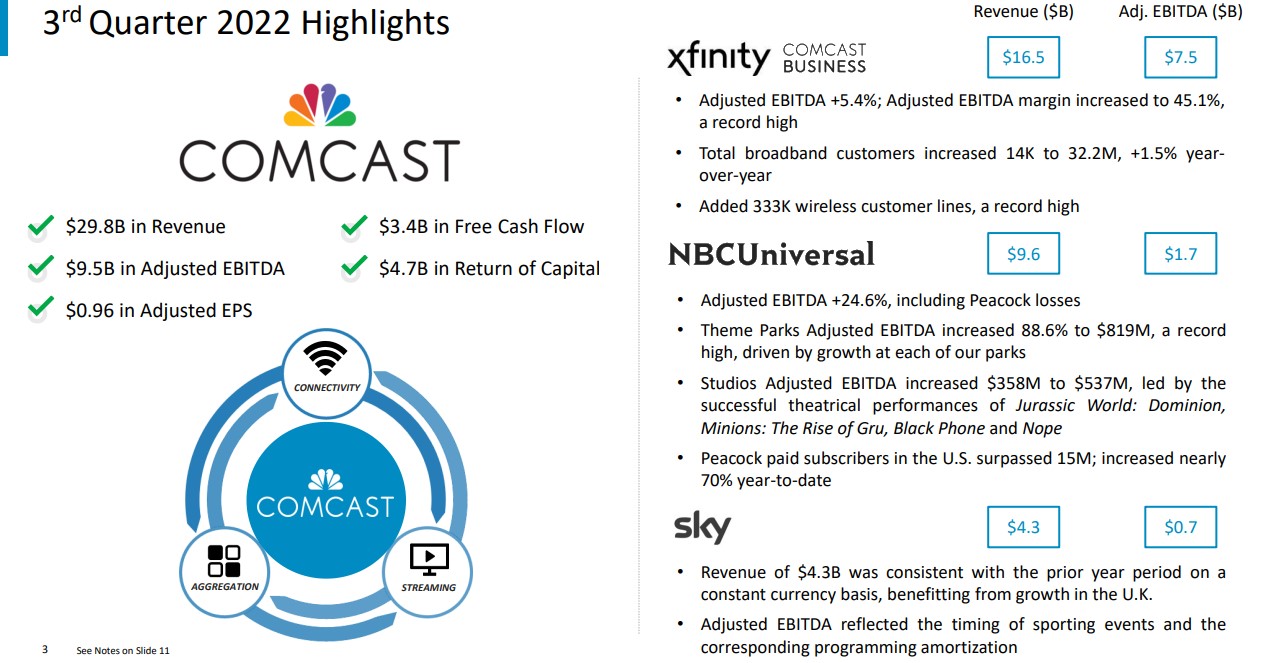
Source: Investor Presentation
Comcast has had 14 consecutive dividend increases. The fast dividend growth was possible through solid earnings growth and a safe dividend payout ratio. Its dividend is well-covered by earnings and cash flows. Comcast is one of the largest players in the entertainment industry. New market entrants would have to spend many billions of dollars to establish themselves as key cable player or entertainment network.
The cable industry is impacted by the nationwide cord-cutting trend, though, as some customers are ditching traditional pay TV entirely. Comcast has so far been able to withstand this trend through growth from its other businesses.
Click here to download our most recent Sure Analysis report on CMCSA (preview of page 1 of 3 shown below):
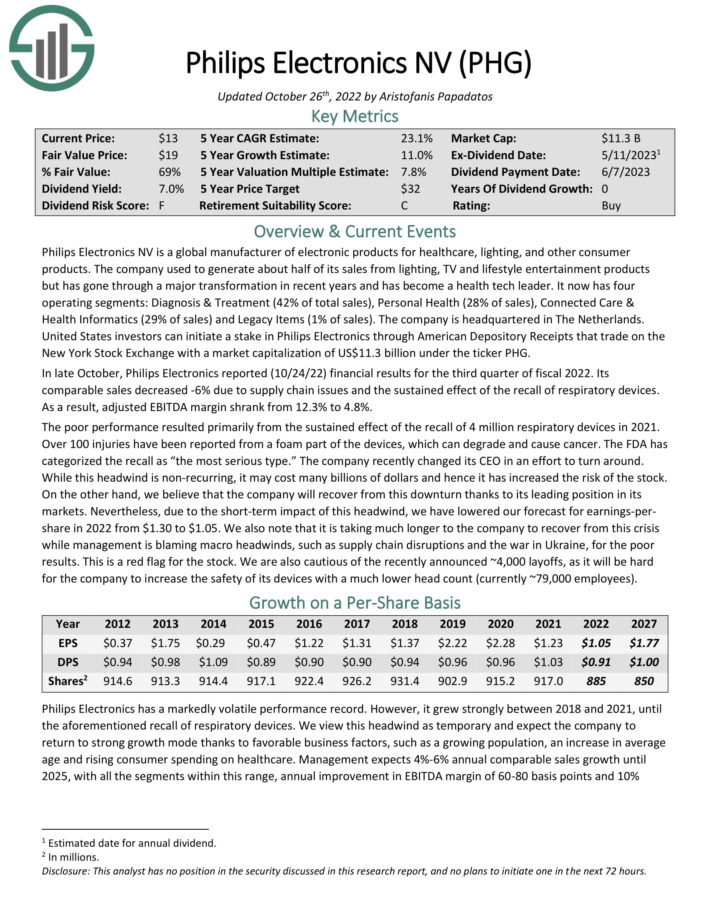
#8: Koninklijke Philips N.V. (PHG)
- Expected annual returns: 22.7%
Philips Electronics NV is a global manufacturer of electronic products for healthcare, lighting, and other consumer products. The company used to generate about half of its sales from lighting, TV, and lifestyle entertainment products but has gone through a major transformation in recent years and has become a health tech leader.
It now has four operating segments: Diagnosis & Treatment (42% of total sales), Personal Health (28% of sales), Connected Care & Health Informatics (29% of sales), and Legacy Items (1% of sales). The company is headquartered in The Netherlands.
In late October, Philips Electronics reported (10/24/22) financial results for the third quarter of fiscal 2022. Its comparable sales decreased by -6% due to supply chain issues and the sustained effect of the recall of respiratory devices. As a result, the adjusted EBITDA margin shrank from 12.3% to 4.8%.
Philips Electronics has a strong brand name, which provides a competitive advantage in the current product categories of the company. Moreover, the company generates more than 60% of its sales from the #1 or #2 position based on market share for its respective products. This provides some pricing power to the company.
Click here to download our most recent Sure Analysis report on PHG (preview of page 1 of 3 shown below):
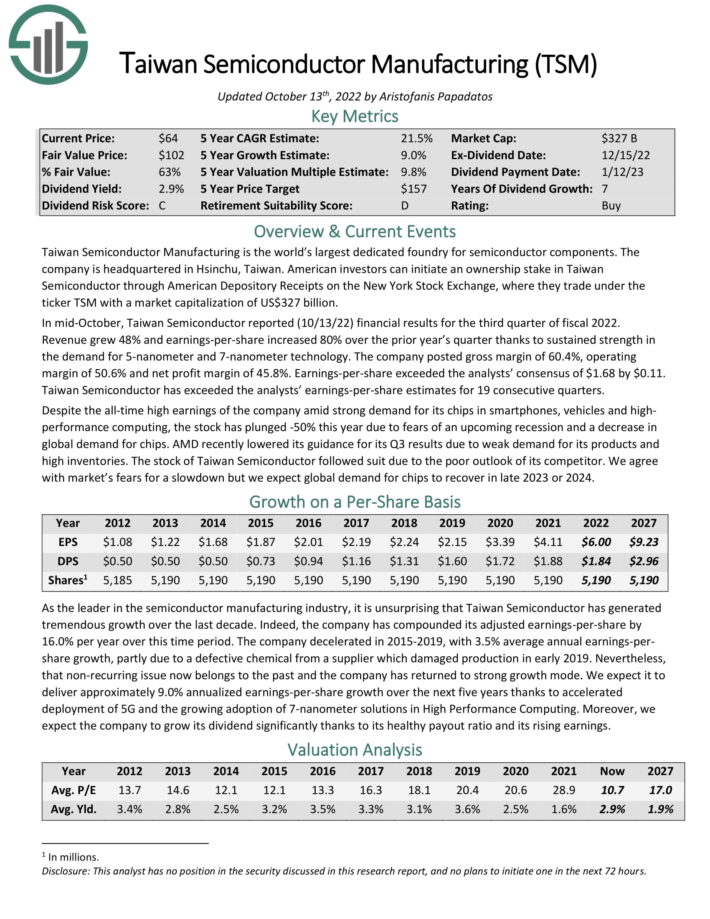
#7: Taiwan Semiconductor Manufacturing (TSM)
- Expected annual returns: 22.7%
Taiwan Semiconductor Manufacturing is the world’s largest dedicated foundry for semiconductor components. The company is headquartered in Hsinchu, Taiwan. TSM is a mega-cap stock with a market capitalization of US$300 billion.
In mid-October, Taiwan Semiconductor reported (10/13/22) financial results for the third quarter of fiscal 2022. Revenue grew 48% and earnings-per-share increased 80% over the prior year’s quarter thanks to sustained strength in the demand for 5-nanometer and 7-nanometer technology.
The company posted a gross margin of 60.4%, an operating margin of 50.6%, and a net profit margin of 45.8%. Earnings-per-share exceeded the analysts’ consensus of $1.68 by $0.11. Taiwan Semiconductor has exceeded the analysts’ earnings-per-share estimates for 19 consecutive quarters.
We expect TSM to deliver approximately 9.0% annualized earnings-per-share growth over the next five years thanks to the accelerated deployment of 5G and the growing adoption of 7-nanometer solutions in High-Performance Computing. Moreover, we expect the company to grow its dividend significantly thanks to its healthy payout ratio and its rising earnings.
Click here to download our most recent Sure Analysis report on TSM (preview of page 1 of 3 shown below):
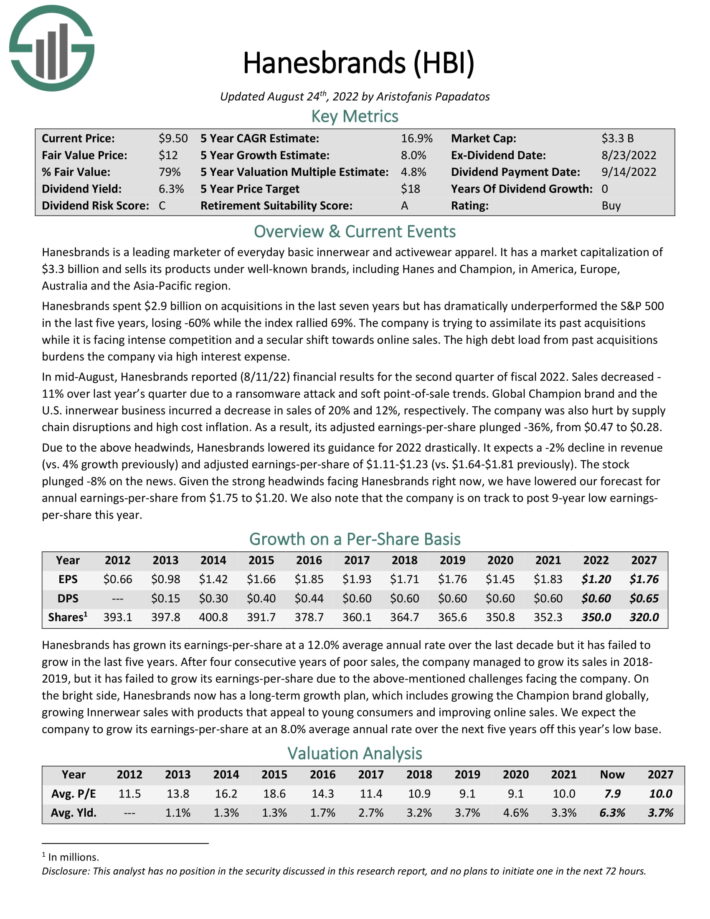
#6: Hanesbrands Inc. (HBI)
- Expected annual returns: 23.0%
Hanesbrands is a leading marketer of everyday basic innerwear and activewear apparel. It sells its products under well-known brands, including Hanes and Champion, in America, Europe, Australia, and the Asia-Pacific region.
In mid-August, Hanesbrands reported (8/11/22) financial results for the second quarter of fiscal 2022. Sales decreased by 11% over last year’s quarter due to a ransomware attack and soft point-of-sale trends. Global Champion brand and the U.S. innerwear business incurred a decrease in sales of 20% and 12%, respectively. The company was also hurt by supply chain disruptions and high-cost inflation. As a result, its adjusted earnings-per-share plunged -36%, from $0.47 to $0.28.
Due to the above headwinds, Hanesbrands lowered its guidance for 2022 drastically. It expects a -2% decline in revenue (vs. 4% growth previously) and adjusted earnings-per-share of $1.11-$1.23 (vs. $1.64-$1.81 previously).
We expect Hanesbrands to generate 8% annual EPS growth moving forward, while the stock has an 8.1% dividend yield. Total returns are estimated at 23% per year over the next five years.
Click here to download our most recent Sure Analysis report on HBI (preview of page 1 of 3 shown below):
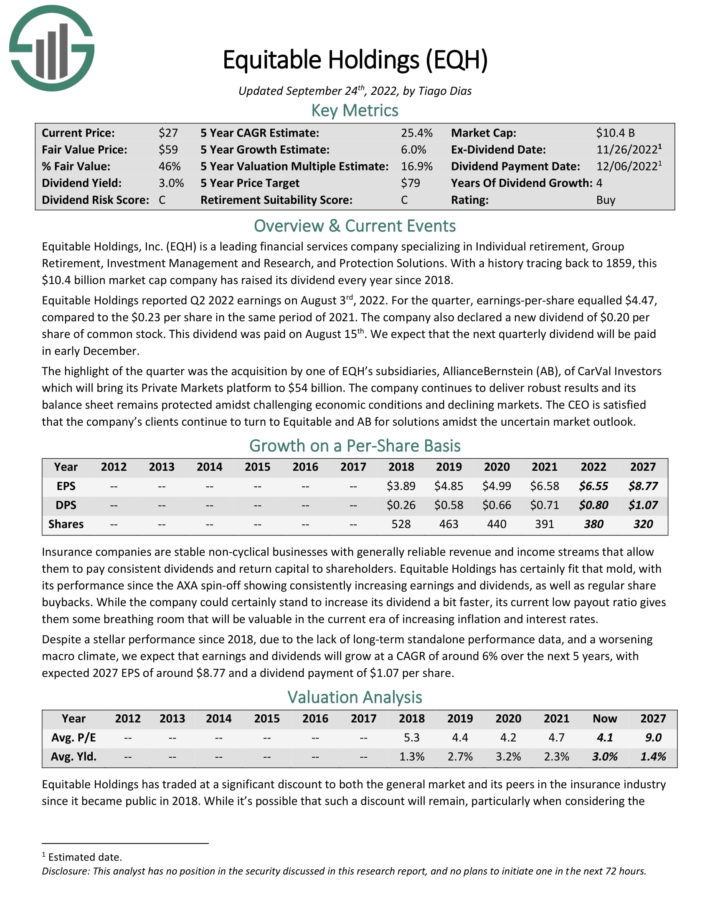
#5: Equitable Holdings Inc. (EQH)
- Expected annual returns: 23.2%
Equitable Holdings, Inc. is a leading financial services company specializing in Individual Retirement, Group Retirement, Investment Management, Research, and Protection Solutions.
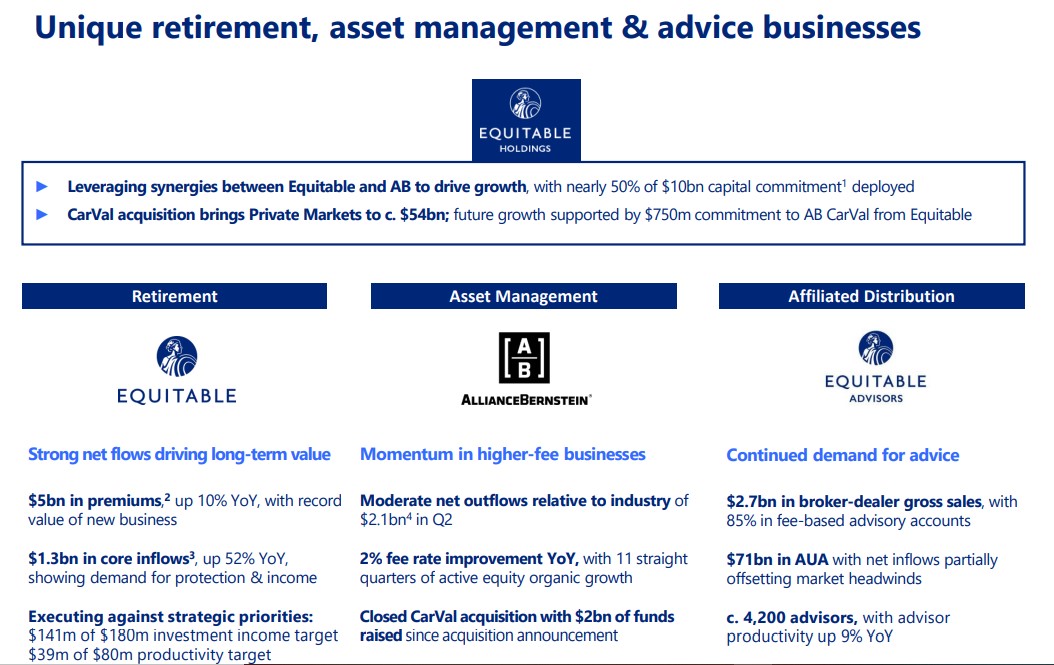
Source: Investor Presentation
Equitable Holdings reported Q2 2022 earnings on August 3rd, 2022. For the quarter, earnings-per-share equaled $4.47, compared to $0.23 per share in the same period of 2021. The company also declared a new dividend of $0.20 per share of common stock. This dividend was paid on August 15th. We expect that the next quarterly dividend will be paid in early December.
The highlight of the quarter was the acquisition by one of EQH’s subsidiaries, AllianceBernstein (AB), of CarVal Investors which will bring its Private Markets platform to $54 billion. The company continues to deliver robust results and its balance sheet remains protected amidst challenging economic conditions and declining markets.
Click here to download our most recent Sure Analysis report on EQH (preview of page 1 of 3 shown below):
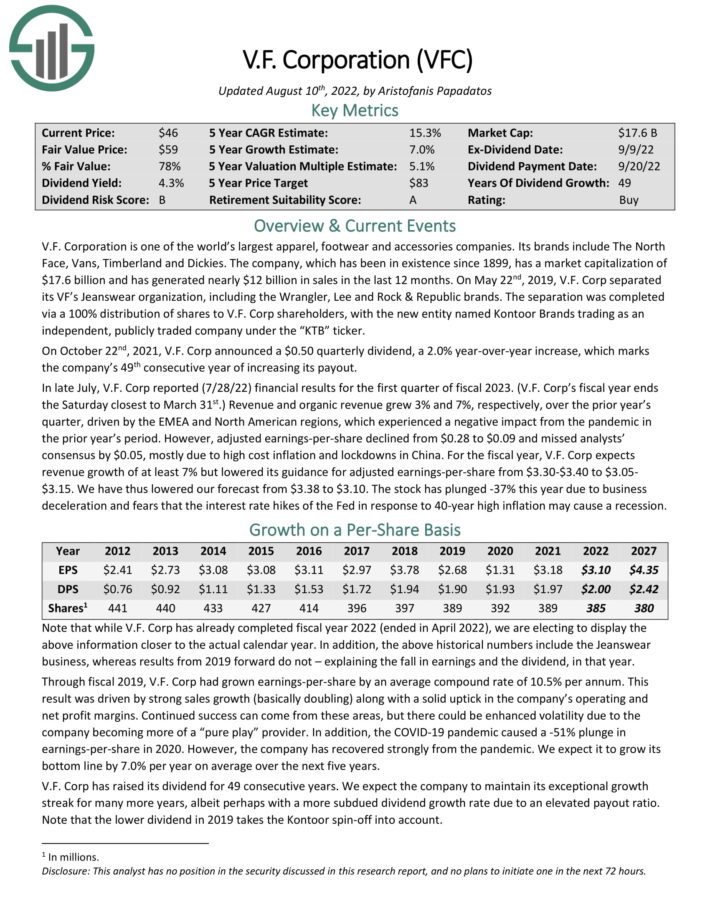
#4: V.F. Corp. (VFC)
- Expected annual returns: 23.6%
V.F. Corporation is one of the world’s largest apparel, footwear and accessories companies. The company’s brands include The North Face, Vans, Timberland, and Dickies. The company, which has been in existence since 1899, generated over $11 billion in sales in the last 12 months.
With a dividend yield above 7%, VFC is one of the highest-yielding Dividend Champions.
In late July, V.F. Corp reported (7/28/22) financial results for the fiscal 2023 first quarter. Revenue of $2.26 billion rose 3.2% year over year and beat analyst estimates by $20 million. The North Face brand led the way with 37% currency-neutral revenue growth in the quarter.
However, inflation took its toll on margins and profits. The gross margin of 53.9% for the quarter declined by 260 basis points while the operating margin of 2.8% declined by 640 basis points. As a result, adjusted EPS declined 68% to $0.09 per share.
Adjusted earnings-per-share grew 67%, from $0.27 to $0.45, but missed analysts’ consensus by $0.02. For the new fiscal year, V.F. Corp expects revenue growth of at least 7% and adjusted earnings-per-share of $3.30 to $3.40. We expect 7% annual EPS growth over the next five years.
In addition, the stock has a current dividend yield of 7.1%. Including a significant return from an expanding P/E ratio, total returns are expected to reach 23.6% per year over the next five years.
Click here to download our most recent Sure Analysis report on V.F. Corp. (preview of page 1 of 3 shown below):
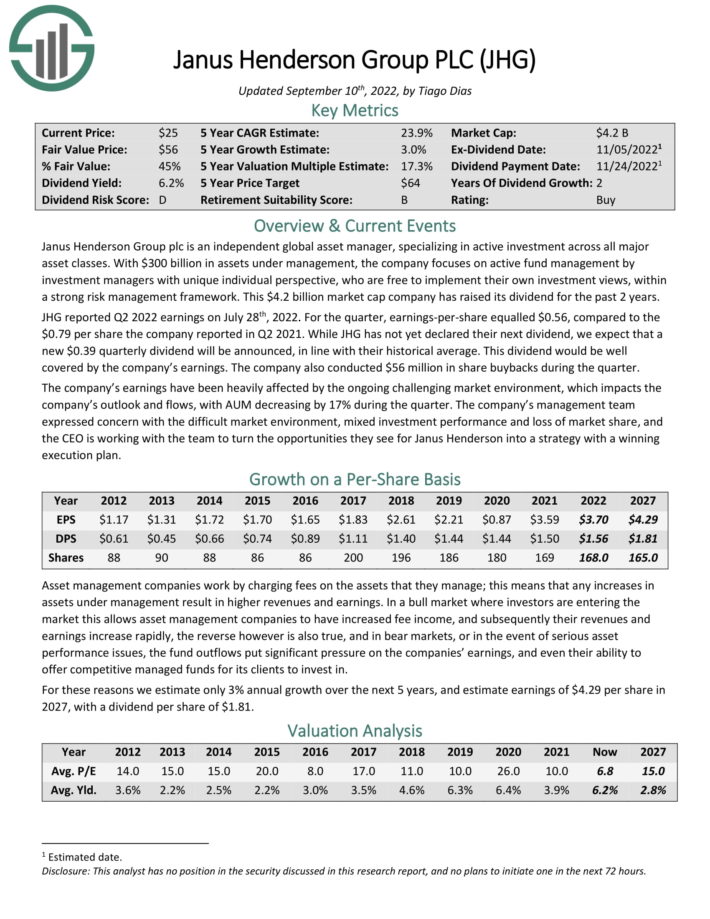
#3: Janus Henderson Group plc (JHG)
- Expected annual returns: 26.8%
Janus Henderson Group plc is an independent global asset manager, specializing in active investment across all major asset classes. With $300 billion in assets under management, the company focuses on active fund management by investment managers with unique individual perspectives, who are free to implement their own investment views, within a strong risk management framework.
JHG reported Q2 2022 earnings on July 28th, 2022. For the quarter, earnings-per-share equaled $0.56, compared to the $0.79 per share the company reported in Q2 2021. The company also conducted $56 million in share buybacks during the quarter. Earnings have been heavily affected by the ongoing challenging market environment, which impacts the company’s outlook and flows, with AUM decreasing by 17% during the quarter.
Janus Henderson has two main competitive advantages over its competitors, scale and history. The $300 billion in assets under management allows them to have enormous economies of scale which permit the company to spend resources to get information advantages over retail and even smaller asset management firms.
This allows them better investment opportunities, and higher returns, while also permitting the charging of smaller and smaller fees. Additionally, the longstanding history of the company allows them to have a long- and well-established client base.
Click here to download our most recent Sure Analysis report on JHG (preview of page 1 of 3 shown below):
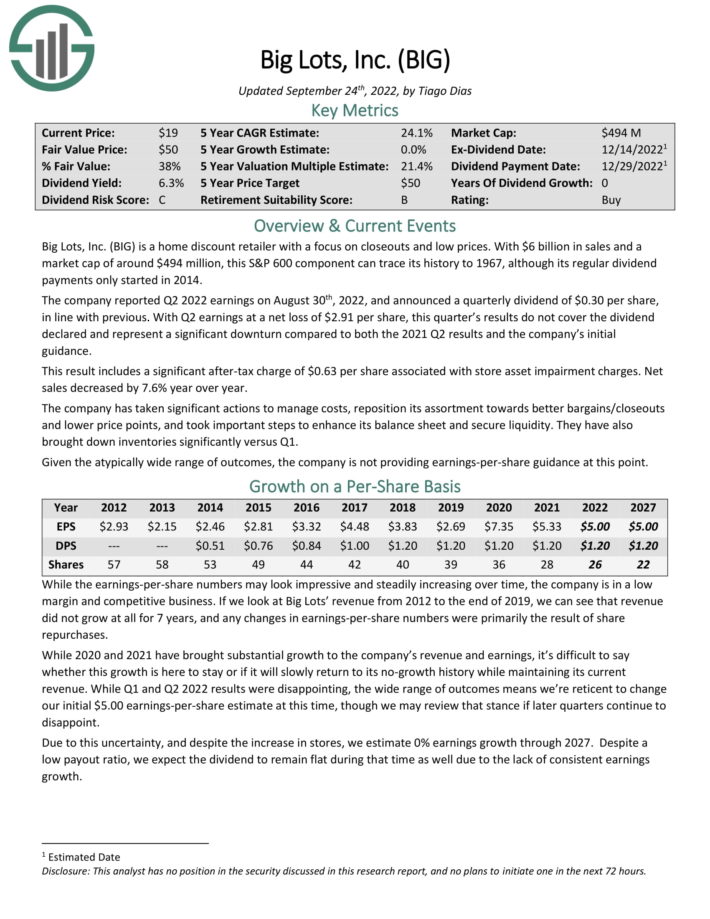
#2: Big Lots Inc. (BIG)
- Expected annual returns: 27.5%
Big Lots is a home discount retailer with a focus on closeouts and low prices. With $6 billion in sales, this S&P 600 component can trace its history to 1967.
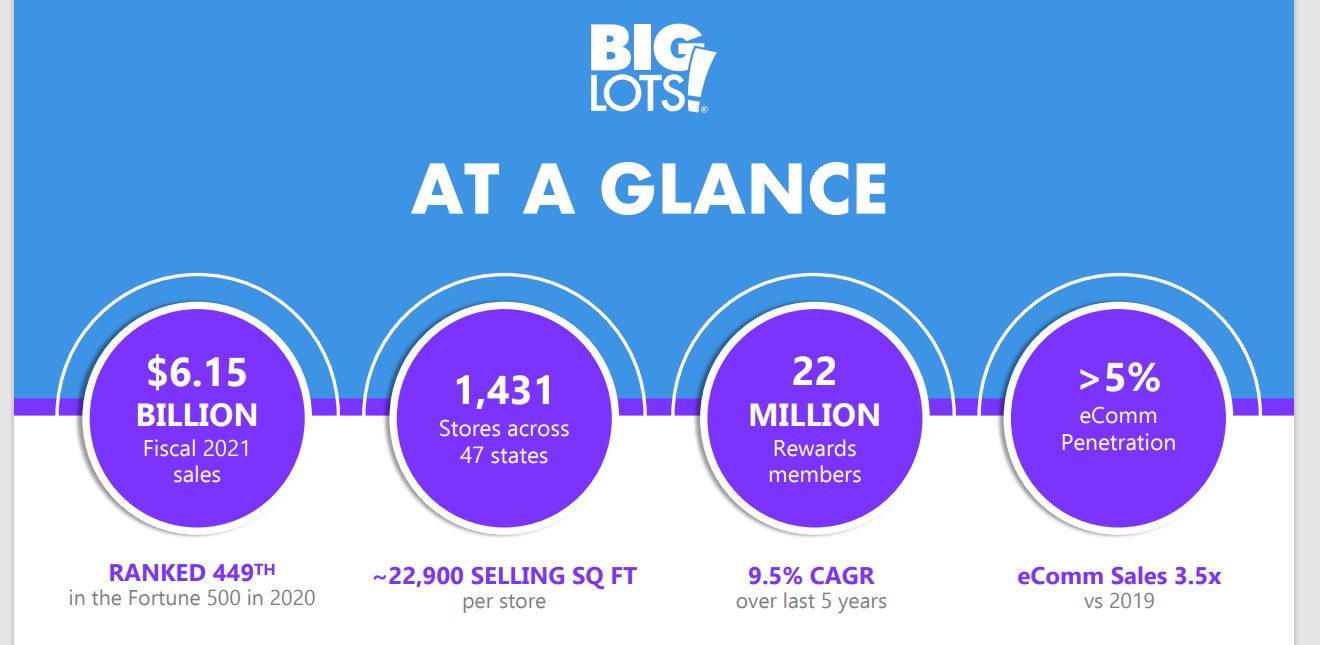
Source: Investor Presentation
The company reported Q2 2022 earnings on August 30th, 2022, and announced a quarterly dividend of $0.30 per share, in line with the previous. With Q2 earnings at a net loss of $2.91 per share, this quarter’s results do not cover the dividend declared and represent a significant downturn compared to both the 2021 Q2 results and the company’s initial guidance.
This result includes a significant after-tax charge of $0.63 per share associated with store asset impairment charges. Net sales decreased by 7.6% year over year. The company has taken significant actions to manage costs, reposition its assortment towards better bargains/closeouts and lower price points, and took important steps to enhance its balance sheet and secure liquidity. They have also brought down inventories significantly versus Q1.
Click here to download our most recent Sure Analysis report on Big Lots (preview of page 1 of 3 shown below):
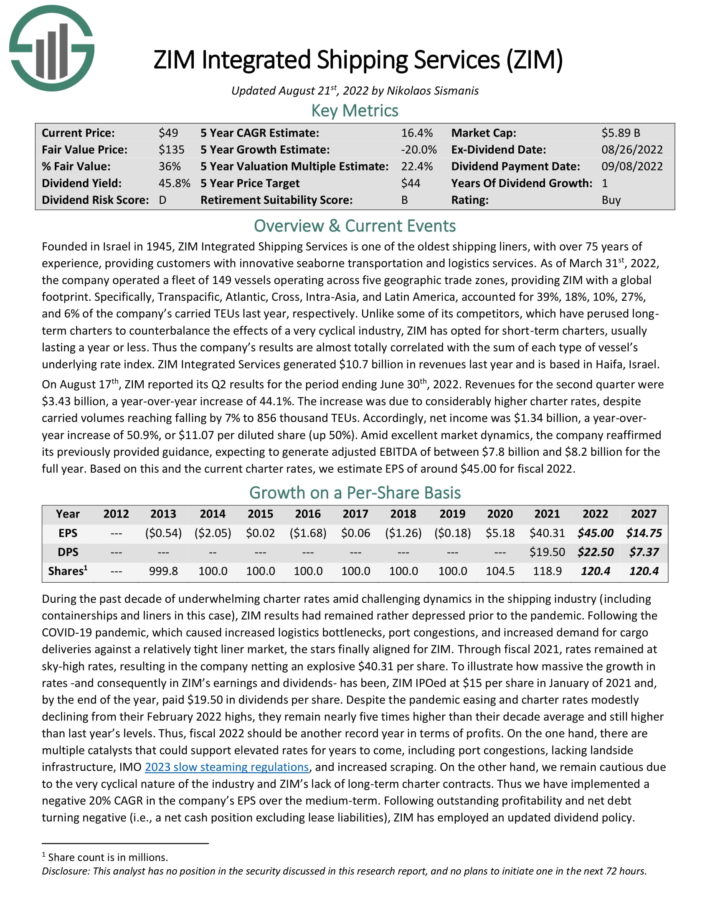
#1: Zim Integrated Shipping Services Ltd. (ZIM)
- Expected annual returns: 33.9%
ZIM Integrated Shipping Services is one of the oldest shipping liners, with over 75 years of experience, providing customers with innovative seaborne transportation and logistics services. As of March 31st, 2022, the company operated a fleet of 149 vessels operating across five geographic trade zones, providing ZIM with a global footprint.
Specifically, Transpacific, Atlantic, Cross, Intra-Asia, and Latin America, accounted for 39%, 18%, 10%, 27%, and 6% of the company’s carried TEUs last year, respectively. Unlike some of its competitors, which have perused long-term charters to counterbalance the effects of a very cyclical industry, ZIM has opted for short-term charters, usually lasting a year or less.
ZIM has taken advantage of the improved operating environment for shipping stocks in the past two years:
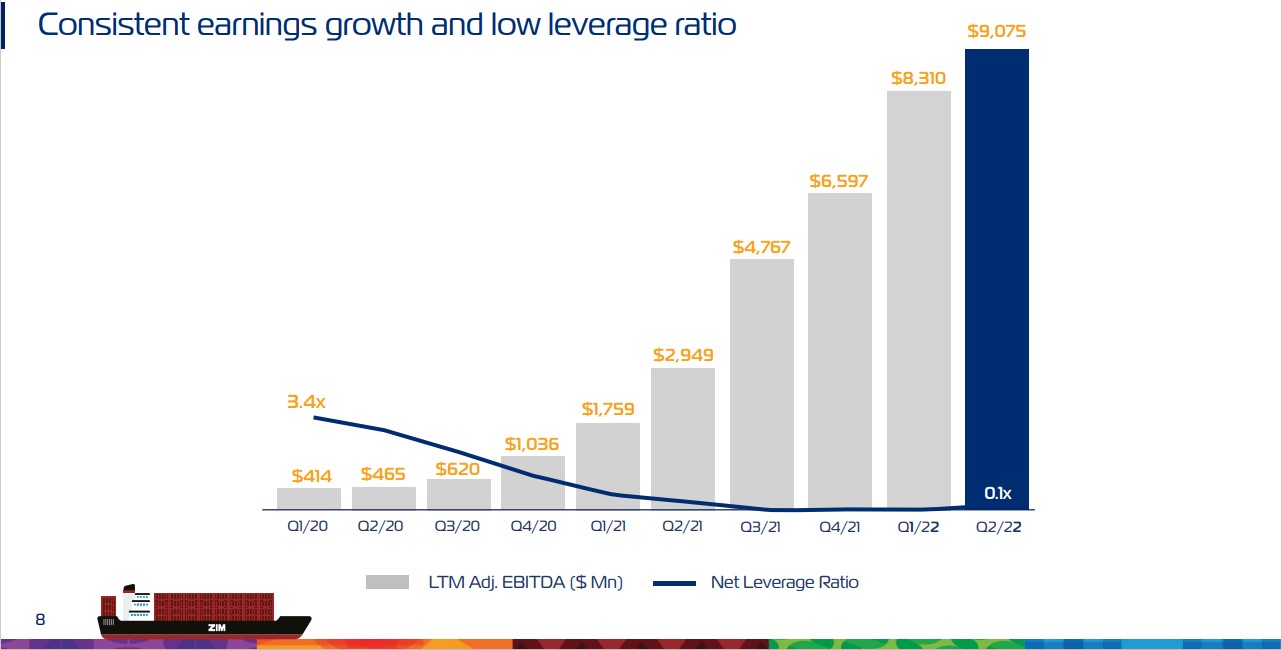
Source: Investor Presentation
Thus the company’s results are almost totally correlated with the sum of each type of vessel’s underlying rate index. ZIM Integrated Services generated $10.7 billion in revenues last year and is based in Haifa, Israel.
On August 17th, ZIM reported its Q2 results for the period ending June 30th, 2022. Revenues for the second quarter were $3.43 billion, a year-over-year increase of 44.1%. The increase was due to considerably higher charter rates, despite carried volumes reaching falling by 7% to 856 thousand TEUs.
Accordingly, net income was $1.34 billion, a year-over-year increase of 50.9%, or $11.07 per diluted share (up 50%). Amid excellent market dynamics, the company reaffirmed its previously provided guidance, expecting to generate adjusted EBITDA of between $7.8 billion and $8.2 billion for the full year.
Click here to download our most recent Sure Analysis report on ZIM (preview of page 1 of 3 shown below):
Final Thoughts & Additional Reading
These 10 dividend stocks are attractive for income investors, not just for their dividend yields, but also for their high total return potential. Still, investors should assess each of these dividend stocks before buying. Stocks with higher return potential generally carry higher risk.
More By This Author:
3 High-Yield Stocks That Can Be Held For Decades
7 High Dividend Growth REITs For The Long Run
7 Best Shipping Stocks Now


Good info, thanks.