
US Dollar Drops After Bearish Evening Star: Are USD Bulls Done?
DOW, S&P BREAKOUTS AS USD-WEAKNESS SHOWS UP
It’s been a fairly climactic week across global markets, and for US equity traders the release of that building tension has worked out in a positive way. While the S&P 500 and the Dow had spent much of the prior three months coiling-up into congestion patterns, giving the appearance of a possible down-side break; this week saw bulls take over, eliciting topside breakouts and prices are now running towards fresh monthly highs.
We looked into this setup in the Dow on Wednesday morning, looking to the confluent area around 24,555 for topside breakouts into Fibonacci resistance around 24862. Given the timing of this move around US inflation figures, this presents a backdrop of continuation potential given that a point of pressure for equity markets has been removed, or at least softened. After March inflation numbers printed with strong surprises, the fear was beginning to creep-in that runaway inflation could compel the Fed into an even more-hawkish stance. The release of yesterday’s numbers showed that this isn’t a major concern at the moment as both headline and Core CPI printed at-or-inside-of expectations.
DOW DAILY CHART: TOPSIDE BREAK OF DESCENDING WEDGE BRINGS BULLISH CONTINUATION POTENTIAL
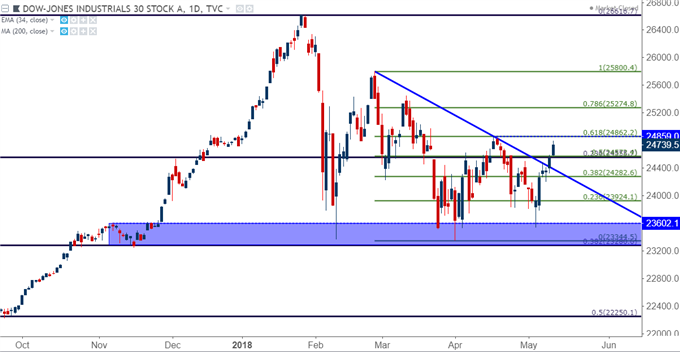
Chart prepared by James Stanley
US DOLLAR PRINTS BEARISH EVENING STAR AT RESISTANCE
Perhaps not coincidentally, that bullish breakout in US equities came-along at the same time as a bearish reversal in the US Dollar. We were following a key area of resistance on the Greenback this week at the 93.35 level in DXY. After a test on Tuesday, Wednesday produced a Doji and Thursday with bearish follow-thru; the net of which was a bearish evening star formation. These three candle formations can be attractive for trading reversals as it shows a market probing an area of resistance before a tonality change takes place; and we looked at this in-depth in yesterday’s webinar entitled, US Dollar Price Action Setups After CPI-Fueled Pullback.
So far in Friday trade, that formation is following-thru as sellers appear to have control of short-term price action. This keeps the door open for a deeper drop in USD as we move towards next week.
US DOLLAR DAILY CHART: BEARISH EVENING STAR FORMATION AT RESISTANCE
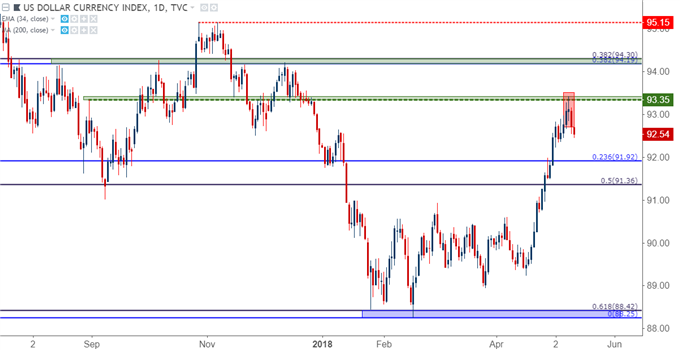
Chart prepared by James Stanley
USD: SHORTERT-TERM SUPPORT POTENTIAL
On a shorter-term basis, the US Dollar is finding support at the ‘s2’ level that we’ve been following around 92.50. A bit deeper is another level at 92.22, and then we have a Fibonacci level at 91.92. That 91.92 level could be especially interesting for support as this is the 23.6% retracement of the 2017-2018 down-trend.
US DOLLAR VIA ‘DXY’ HOURLY CHART: PRICES FIND SUPPORT AROUND 92.50
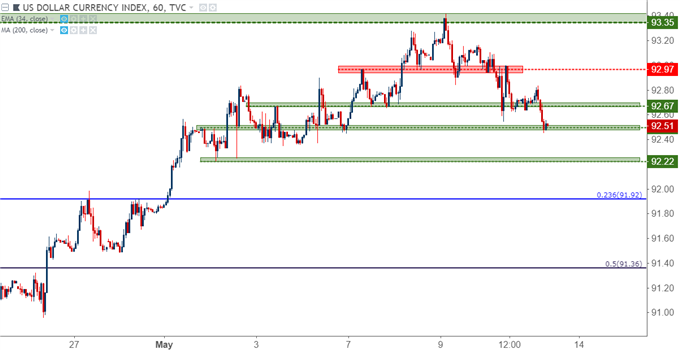
Chart prepared by James Stanley
That Fibonacci level around 91.92 is interesting for a couple of reasons, as this area is also confluent with the 38.2% retracement of the recent bullish move. And below that – we have another area of confluence around 91.36, as this is the 50% retracement of the 2014-2017 move, while also being near the 50% retracement of the recent bullish trend. This presents a backdrop of possible topside continuation; should buyers show up in the zone that runs from 91.82-91.92 or, a bit lower in the zone around 91.36, the door for bullish USD-setups re-opens. This could be especially attractive in pairs like NZD/USD or even EUR/USD should resistance show around 1.2000.
US DOLLAR FOUR-HOUR CHART: CONFLUENT FIBONACCI SUPPORT POTENTIAL FROM RECENT MAJOR MOVE
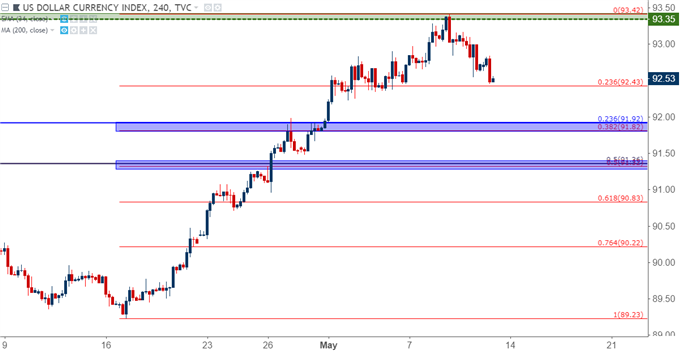
Chart prepared by James Stanley
GBP/USD – A WEEK OF GRIND AT SUPPORT AS BOE GOES DOVISH (AGAIN)
The Bank of England went dovish again, as has been par for the course around the bank since the Brexit referendum. In perhaps an ironic if not cruel twist of fate, the BoE made their first hawkish announcements at the bank’s Super Thursday in February, warning that rate hikes would be ‘faster and to a somewhat greater extent’ than previously thought, largely in response to inflation that just would not slow down, even after the BoE’s rate hike in November.
Ironically, the next month showed inflation slowing down; and the following month showed an even deeper slowing when CPI printed at 2.5%. This is still well above the BoE’s target by 25% (2.5% v/s 2%), but given the scope of the slowdown and also taken with the abysmal GDP print from last quarter, and the BoE didn’t feel they had the wherewithal to hike; instead reverting back to their old language of saying that rate hikes will be ‘gradual and slow’.
DATA DEPENDENT BOE SEES TWELVE CONSECUTIVE MONTHS OF INFLATION 25% ABOVE TARGET (2.5% V/S 2%)
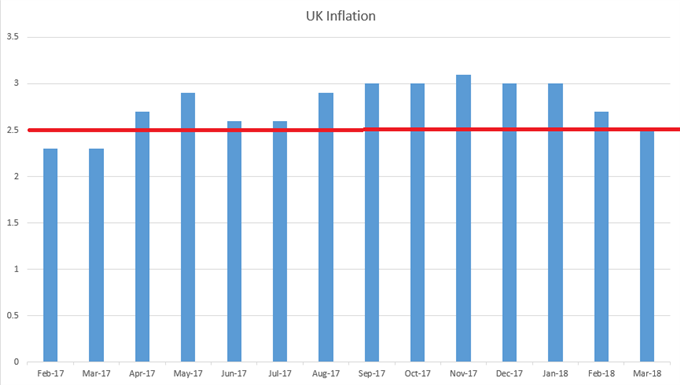
Chart prepared by James Stanley
What’s interesting here is the responsiveness at the Bank, as it appears as though the BoE is so driven by short-term implications that they’re making years-long decisions on the basis of a couple of months of data, if not less. The bank launched a bazooka of stimulus in the immediate wake of the Brexit referendum, far before any significant slowdown in the British economy could show in the data. That bazooka of stimulus dented the British Pound and depressed bond yields; and that massive hit to the value of the Pound is what led into last year’s 3% rates of inflation.
And last year, the British consumer just continued to push-forward, Keeping Calm Whilst Carrying On. In January of last year, we even heard a mea culpa from the BoE’s Chief Economist, Andy Haldane, saying that the slowdown that the Bank expected on the back of Brexit just had not shown up yet; but the BoE continued to remain loose and dovish throughout the year, only looking at rate hikes in November when inflation had crossed the 3% marker in both September and October.
So the shift that we saw in February was important because this was the first time that the BoE had posed a hawkish outlook since Brexit. This had primed markets for a rate hike at this week’s meeting, and that bullish shift at the BoE helped to super-charge the pair in March and April. This brought on fresh post-Brexit highs as we moved into Q2; but as that negative data was beginning to show in mid-April, an aggressive reversal took place that drove the currency for much of the next three weeks. Prices ran into a key zone of long-term support last Friday, and after spending the entire week grinding around this zone, prices have started to tick-higher as we near the end of the week.
This presents an interesting reversal scenario, particularly should USD-weakness come back into the fray on a bigger-picture basis.
GBP/USD BOUNCING AFTER HOLD OF KEY SUPPORT THROUGH BOE ‘SUPER THURSDAY’
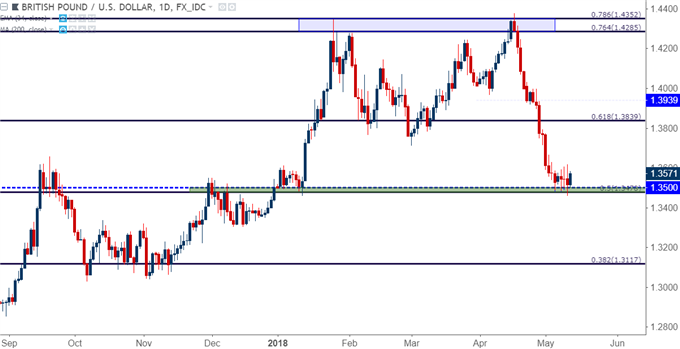
Chart prepared by James Stanley
EUR/USD: WATCH 1.2000 AS POTENTIAL ‘DECISION LEVEL’
Going along with that aggressive run of US Dollar strength was a similarly aggressive run of Euro-weakness. EUR/USD spent most of the past three weeks running-lower within a consistent bearish channel, and that finally met it’s maker this week when buyers were able to push prices back-above 1.1900. The big question at this point is what happens at 1.2000. This is a major psychological level, and prices finding some element of resistance here could make an attractive scenario of bearish continuation. Conversely, if sellers aren’t able to defend this level, the prospects of short-side continuation won’t look so attractive, and a sustained break-through could re-open the door to bullish strategies.
EUR/USD FOUR-HOUR CHART: KEY AREA OF 1.2000 AS ‘DECISION POINT’
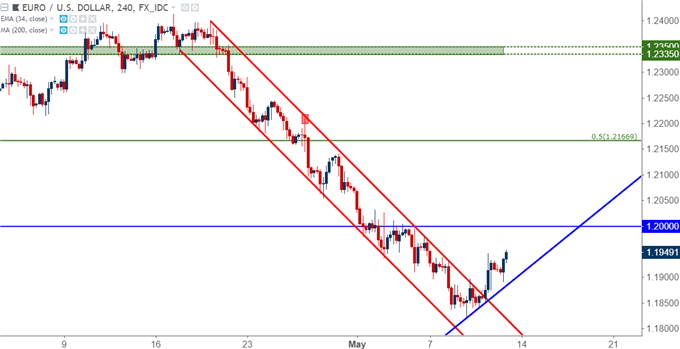
Chart prepared by James Stanley
FOR USD-STRENGTH TO CONTINUE, NZD/USD
The pair that we’ve been following for USD-strength over the past month has been NZD/USD, and this is largely coming from a longer-term range that’s been in-effect for almost two years now. We looked at a short-side setup in NZD/USD as the pair was tilting away from resistance; and as USD-strength began to scream in the weeks later, that setup started to fill-in. We’ve stopped short of longer-term support, though, and prices are now moving back towards the .7000 psychological level.
NZD/USD WEEKLY CHART: RANGE IN-FORCE FOR ALMOST TWO YEARS
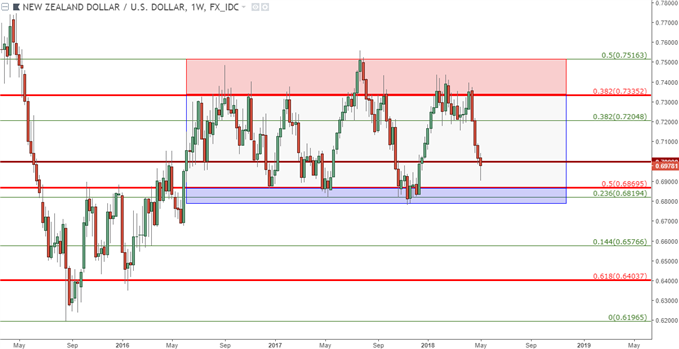
Chart prepared by James Stanley
On a shorter-term basis, we had a target met yesterday morning at the .6900 figure, and prices have started to bounce thereafter. This re-opens the door for resistance potential at the big-figure of .7000; and if the Dollar does have a deeper drop before longer-term support comes in, resistance potential exists in NZD/USD at .7053 and .7095; each of which could open the door for short-side continuation setups.
NZD/USD HOURLY CHART
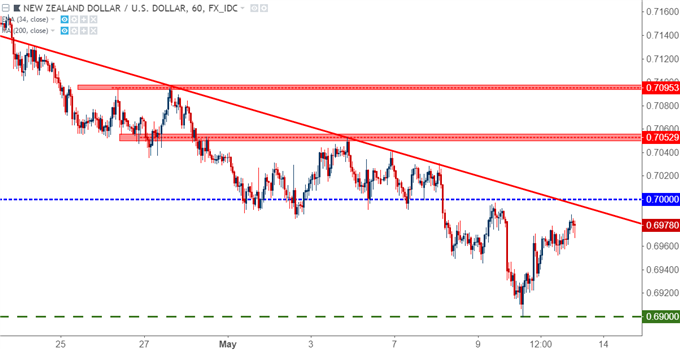
Chart prepared by James Stanley


Interesting article. About the UK, the BOE always tries countercyclical efforts, and doesn't wait til things break like the Fed does. UK citizens are protected and were protected in the Great Recession by a bank, the BOE, that was very quick to supply credit when the Fed did not. It is almost as if the UK citizen is favored over the US citizen in the central banking world.