
The Trends For Median New Home Sale Prices
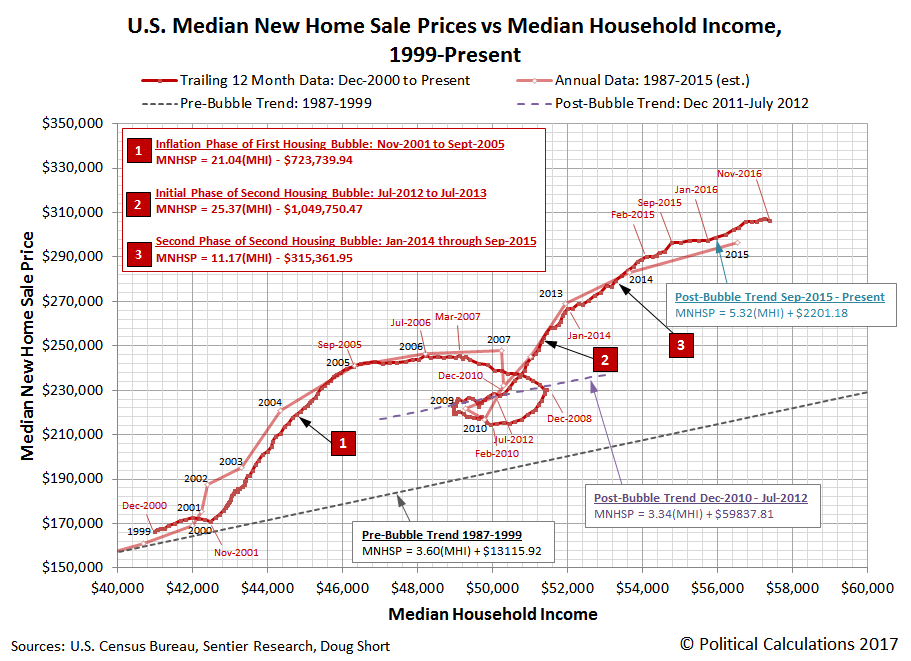
Median new home sale prices in the United States are continuing their slow climb, at least according to data that the U.S. Census Bureau released in late December 2016, where since September 2015, median sale prices have generally risen by $5.32 for every $1 increase in median household income.
We can see that slower growth trend more clearly by focusing on how median new home sale prices have evolved over time in recent years, which are shown in the following chart from July 2012 onward.
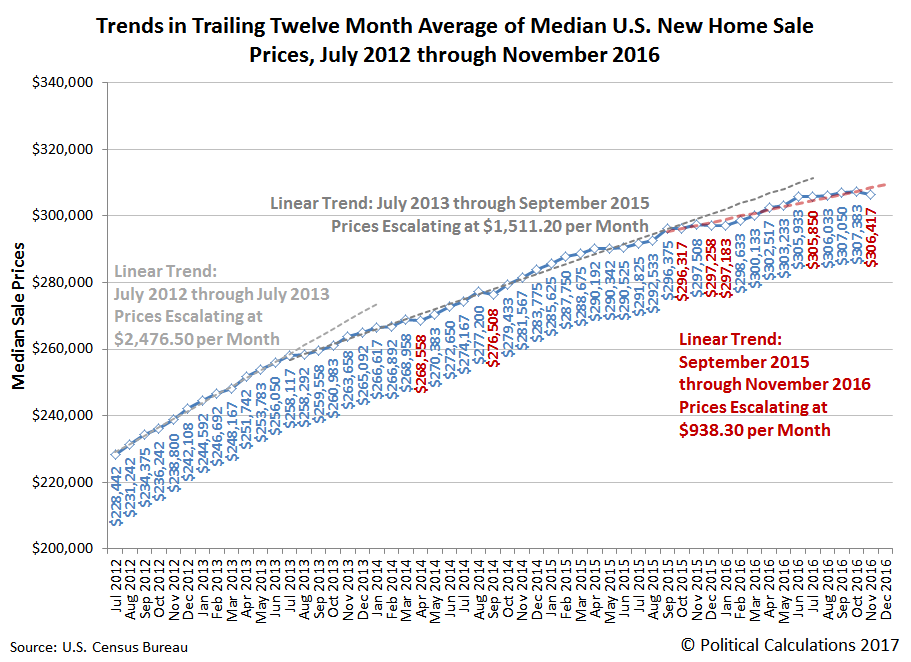
As a quick recap of what has been happening in the more recent trends, since September 2015, median new home sale prices in the U.S. have been escalating at an average rate of $938 per month, which is about 38% of their rate of inflation of $2,476 per month during the year from July 2012 through July 2013, when a number of Wall Street investment firms were snapping up thousands of homes out of foreclosure each month, which worked to constrain the available supply for home buyers, who were shunted into the new home market.
From July 2013 through September 2015, median new home sale prices rose at an average clip of $1,511 per month, as the pace of investor activity slacked off, before largely dissipating after September 2015, which allowed the relative supply of new homes to increase, as regular home buyers could once again purchase existing homes without being outbid.
And that's where we find ourselves now, as the new home sale price data has yet to take the effect of rapidly rising mortgage rates in November and December 2016 into full account. The next several months will be interesting to see how that factor plays into the prices of new homes sold.
References
Sentier Research. Household Income Trends: November 2016. [PDF Document]. 29 December 2016. [Note: We have converted all the older inflation-adjusted values presented in this source to be in terms of their original, nominal values (a.k.a. "current U.S. dollars") for use in our charts, which means that we have a true apples-to-apples basis for pairing this data with the median new home sale price data reported by the U.S. Census Bureau.]
U.S. Census Bureau. Median and Average Sales Prices of New Homes Sold in the United States. [Excel Spreadsheet]. Accessed 29 December 2016.
Disclosure: None.

Comments
 No Thumbs up yet!

