
The Tide Just Flipped To Bullishness, But Just Barely
The strength we saw in the early part of the shortened trading week petered out in the latter part of the week. But, it doesn't entirely matter. The bulls dealt their blow to the bears and cleared a key hurdle in the process. Despite the fresh headwind, the bulls still have the edge here... for a couple of different reasons.
We'll explore both of those reasons below, in detail. First, however, we're going to run down all of last week's big economic announcements and preview what's in store for this week. There's a huge one due at the end of the five-day stretch.
Economic Data Analysis
Consumer sentiment ticked higher last week, though not as much as expected. The Conference Board's reading improved from April's 85.7 to 86.6 last month, but that missed expectations of 88.5. The University of Michigan Sentiment Index grew from 72.2 to 72.3. Both readings, however, suggest the average consumer isn't mentally recovering as quickly as the market has to the coronavirus stumble.
University of Michigan Sentiment Index Chart
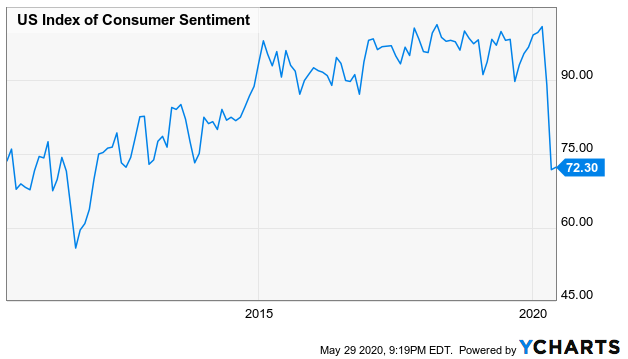
Source: YCharts
On the other hand, new home sales remained firm despite the struggle in showing them and signing purchase papers. Economists forecasted an annualized pace of 485,000, down from Marc's 619,000. For April, however, sales of new homes picked up to a pace of 623,000. Do note that sales of existing homes did not mirror the move for April. They instead fell again to a pace of 4.33 million per year.
Existing Home Sales Index Chart
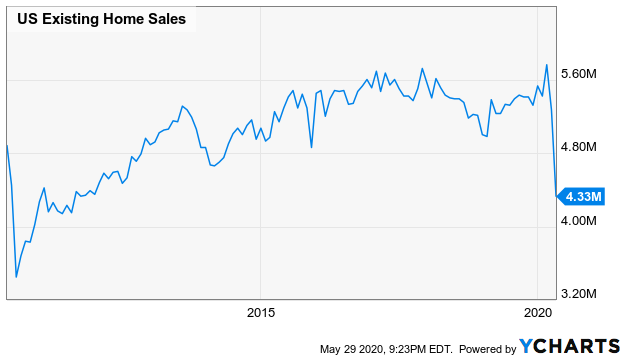
Source: YCharts
Home prices are still holding up reasonably well too. For March, the Case-Shiller Home Price Index grew 3.9% in the midst of the beginning of the COVID-19 pandemic. More recent data from the FHFA, however, says price progress is finally being challenged. The FHFA Housing Price Index improved only 0.1% in April, down from March's 0.8% increase.
Home Price Index Charts
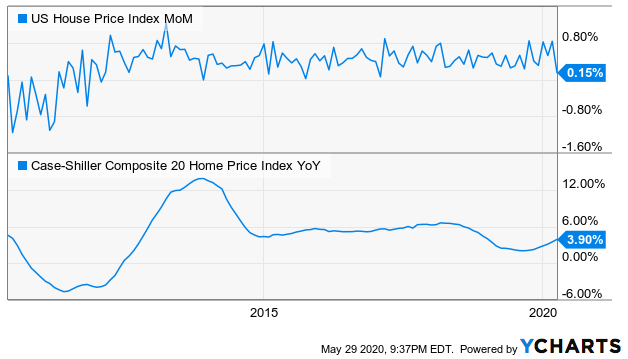
Source: YCharts
Everything else is on the grid.
Economic Calendar
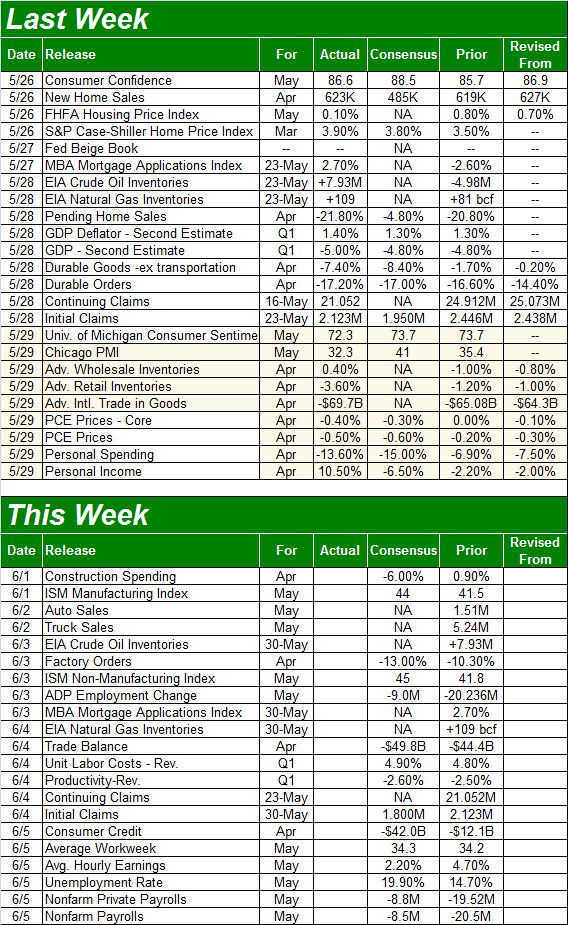
Source: Briefing.com
This week is going to be another busy one, ending with the grand finale of May's jobs report. But, there's plenty to prepare for between now and then.
The week starts with the ISM Manufacturing Index on Monday. Analysts are looking for a slight improvement for May, from 41.5 to 44.0. That's not bad, all things considered. But, that's still below the pivotal 50 level. The ISM Services Index will be updated on Wednesday. Same story.
ISM Manufacturing Chart

Source: YCharts
On Tuesday look for last month's auto sales. Not surprisingly, they've been awful. A lack of capability of getting in the showroom is the biggest impasse, though the industry was already weak/vulnerable before problems materialized.
Auto Sales Charts
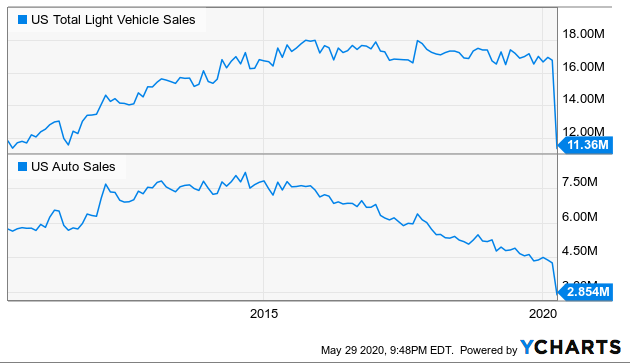
Source: YCharts
The biggie this week, of course, is will be Friday's jobs report. The pros are calling for increased unemployment, from April's 14.7% to 19.9%, on the loss of another 8.5 million jobs. As has been explained more than enough though, most of those job losses are cases where workers are effectively unable to return to a job. It's too soon to draw sweeping conclusions about the strength of the jobs market.
Unemployment and Payroll Growth Charts
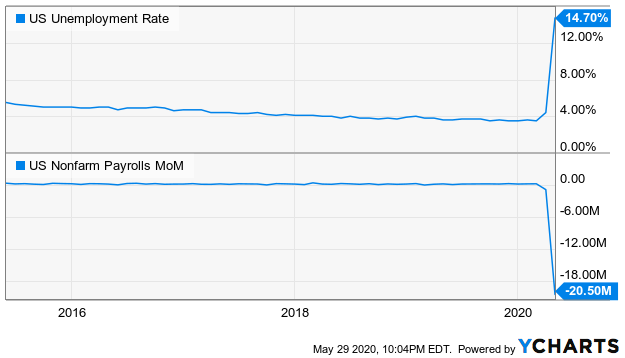
Source: YCharts
Stock Market Index Analysis
A week ago we were cautioning traders about the fact that the S&P 500 had not yet cleared its 100-day or 200-day moving average lines. In fact, the 100-day line appeared to be acting as resistance, suggesting the buyers were hesitating when push came to shove. That's no longer a worry. Although the advance slowed as last week wore on, the S&P 500 has moved above both of those lines and appears to be finding support at the 200-day moving average line plotted in white on the daily chart of the index below. Underscoring the bullishness is the volume that had been missing up until this point. In fact, Friday's volume has almost as much as we saw in late March when stocks were reaching their selling climax.
S&P 500 Daily Chart, with VIX and Volume
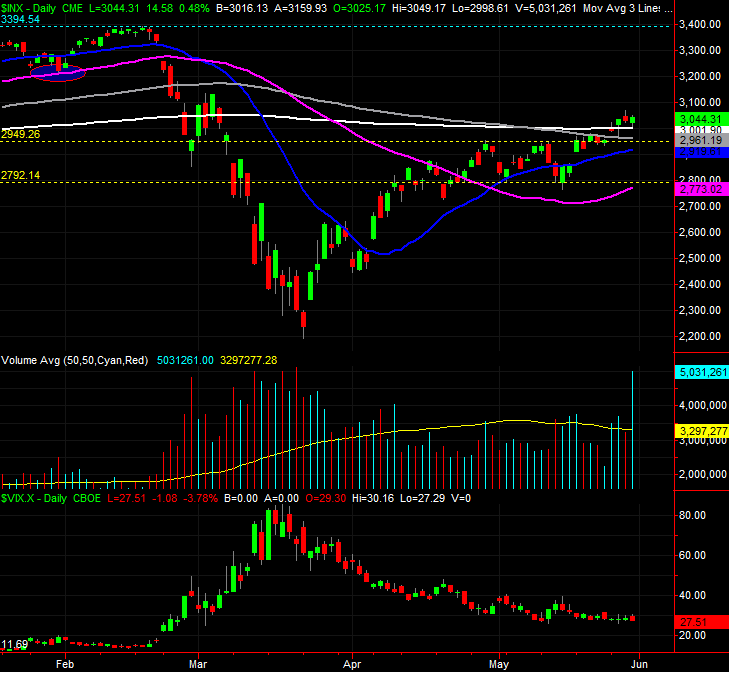
Source: TradeStation
Of course, Friday's volume surge could be acting as a buying climax. To that end, notice the VIX didn't creep lower in step with the S&P 500's modest advance. Traders aren't completely convinced this rally is going to last... at least using option prices as a gauge.
The same basically goes for the NASDAQ, though in a more muted way. Its volume growth has been more even-keeled, and it cleared its long-term moving average lines more than a month ago, closing at its best daily and weekly close in Friday seen since the February peak.
NASDAQ Composite Daily Chart, with VXN
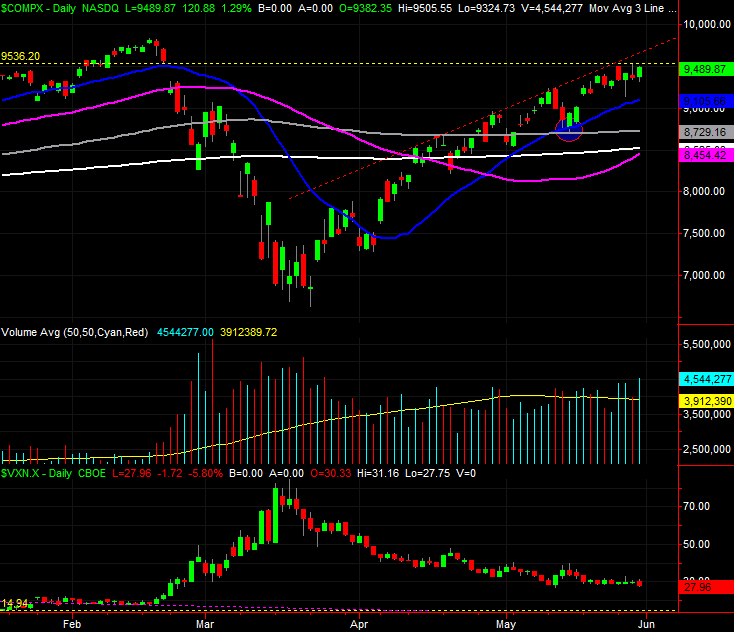
Source: TradeStation
Zooming out to the weekly chart of either index doesn't really tells us anything new. But, it does provide some more perspective about where we've been, and where we may be going next. The S&P 500 has recovered about half of all that was lost in the February/March plunge, and while the VIX's decline appears to be slowing, it's still edging lower. In some regards, that more controlled decline is actually healthier than a plunging decline that might drag the VIX all the way to its more absolute low around 11.0. In the same vein, while Friday's volume surge was out of character, there's no denying -- broadly speaking -- volume is improving on the way up. The question is, can that volume growth be sustained (especially now that we're entering the slow summertime)?
S&P 500 Weekly Chart, with Volatility Index
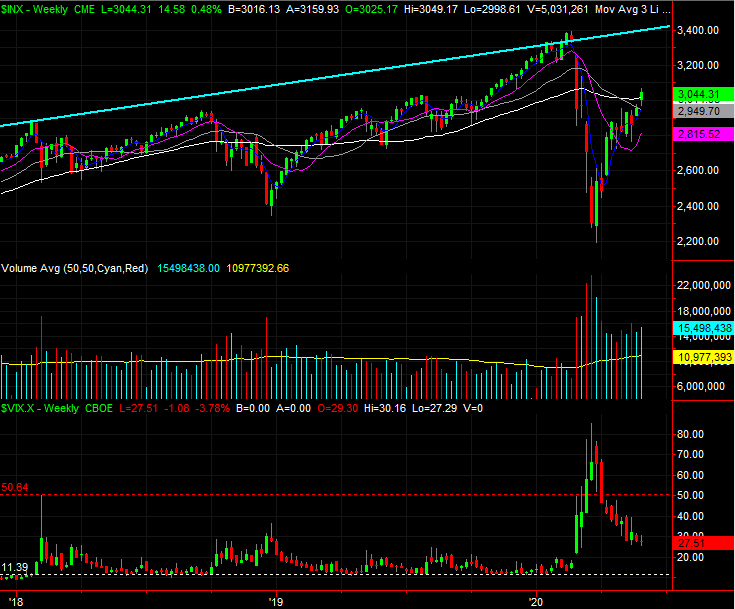
Source: TradeStation
The same goes for NASDAQ's weekly chart. But, there's an extra nuance to note about the composite... though the index is much closer to February's peak than the S&P 500 is, it's not dangerously overbought yet. The RSI oscillator has yet to reach its overbought territory that begins at 70. The composite doesn't necessarily have to hit that mark to reach a top. But, it's certainly something that generally coincide with market tops.
NASDAQ Composite Weekly Chart, with VXN
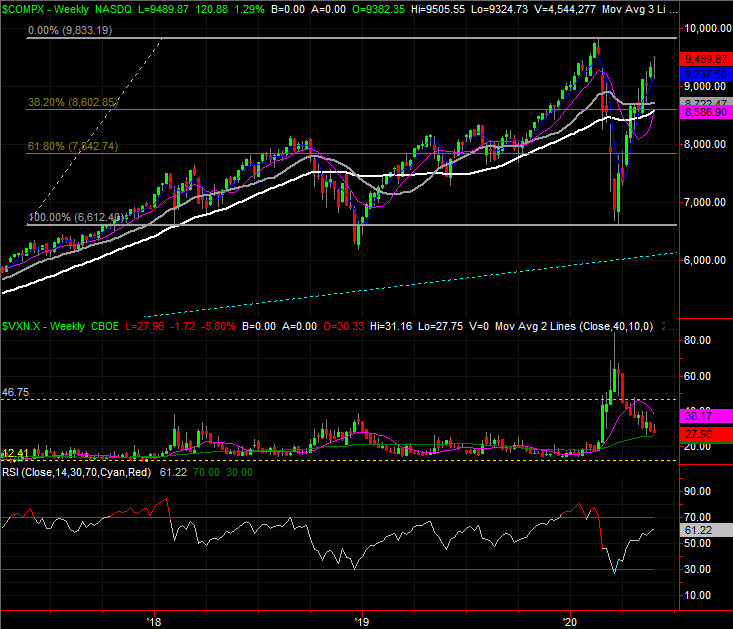
Source: TradeStation
It's still mostly a coin-toss, tethered to coronavirus headlines. The market's fundamentals are shot to be sure, but it's not a problem for most investors because they know it's not an economically-driven one... until they decide it is. In the meantime, the market's got some impressive momentum behind it, but it's technically nearing an overbought condition.
The key is how well the S&P 500 holds up to any test. The 200-day moving average line at 3002 would ideally hold up as a technical floor, though support at the 100-day moving average line currently at 2961 would also be a victory. The 20-day line, currently at 2920, is nearing that level and will bolster the potential for support around that area.


