
Technically Speaking: 2016 Outlook
In the last “Technical Update” I discussed the end of the mutual fund redemption period and the acceleration of the downtrend that began in early December. (Chart updated through yesterday’s close.)
“After a second attempt at the downtrend resistance, the market has built an accelerated downtrend. If the market is unable to reverse this decline in short-order, the odds of a more substantial correction increase.”

Importantly, the projected path that I laid out at the beginning of November, is now in jeopardy as the year-end rapidly approaches. With the recent oversold condition now reversed, there is an increased possibility that the markets will fail to push above the current downtrend line and reverse the ongoing topping process.

However, regardless of how this year ends, it is 2016 that now lies in question. Historically speaking, the 6th and 7th-year of the decennial cycle have some of the highest odds of a negative return year. This is particularly the case given deteriorating earnings, weak economics and a tightening of monetary policy.

2016 Outlook
S&P 500 Posts A Negative Return Year
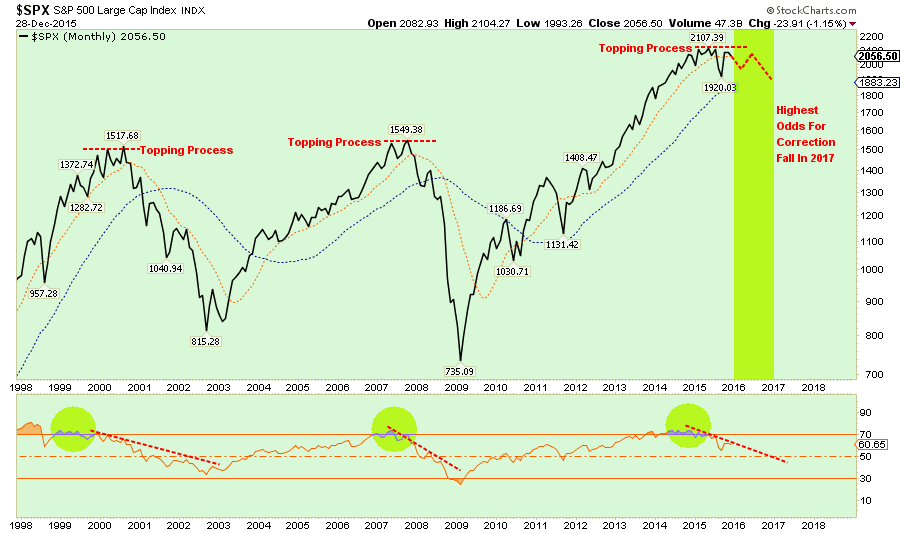
If you take a look around Wall Street, it is hard to find anyone that expects a negative year in 2016. However, bull markets do not last forever and with deteriorating earnings, narrow market breadth and declining momentum, there are ample signs that the first half of this particular market cycle is nearing its end.
As shown in the chart below, there are many similarities between the current market topping process and the previous two bull-market peaks. With the Federal Reserve now intent on tightening monetary policy in a weak economic growth environment, the odds of a negative return year in 2016 has risen markedly.
However, while 2016 is likely to be a negative return year, it is either late 2016 or early 2017 that the economy slips into a recession and the next major market correction occurs. While that is what the historical statistics suggest, it should be noted that previous market cycles did not operate at the lowest average annual rates of economic growth on record. There are many issues that could advance the recessionary cycle/market reversion into 2016.
International Stocks Drag As Well
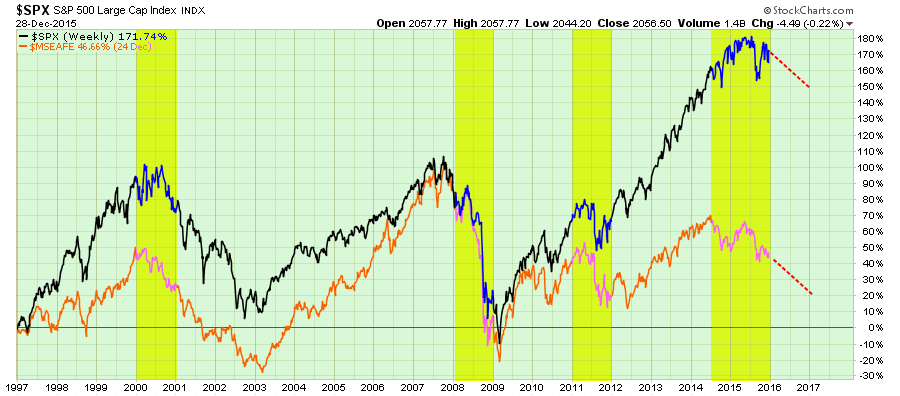
However, it will most likely not be just the S&P 500 that declines in 2016, but industrialized international markets as well. In fact, if history is a guide, the decline in the international markets is already providing a leading indication of a negative return year for the S&P 500. Despite hopes of a stronger economic environment, ongoing liquidity from global Central Banks and negative rates, the reality is that those supports have already been “weighed, measured, and found wanting.”
Interest Rates Decline Below 2%
With the Federal Reserve raising interest rates on the short-end (Fed Funds), it will likely push the long-end of the curve lower as the economy begins to slow from the effects of monetary policy tightening.
From a purely technical perspective, rates have been in a long-term process of a tightening wedge. A breakout to the upside would suggest 10-year treasury rates would soar to 3.6% or higher, the consequence of which would be an almost immediate push of an economy growing at 2% into recession. The most likely path, given the current economic and monetary policy backdrop, will be a decline in rates toward the previous lows of 1.6-1.8%. (Inflation will also remain well below the Fed’s 2% target rate for the same reasons.)
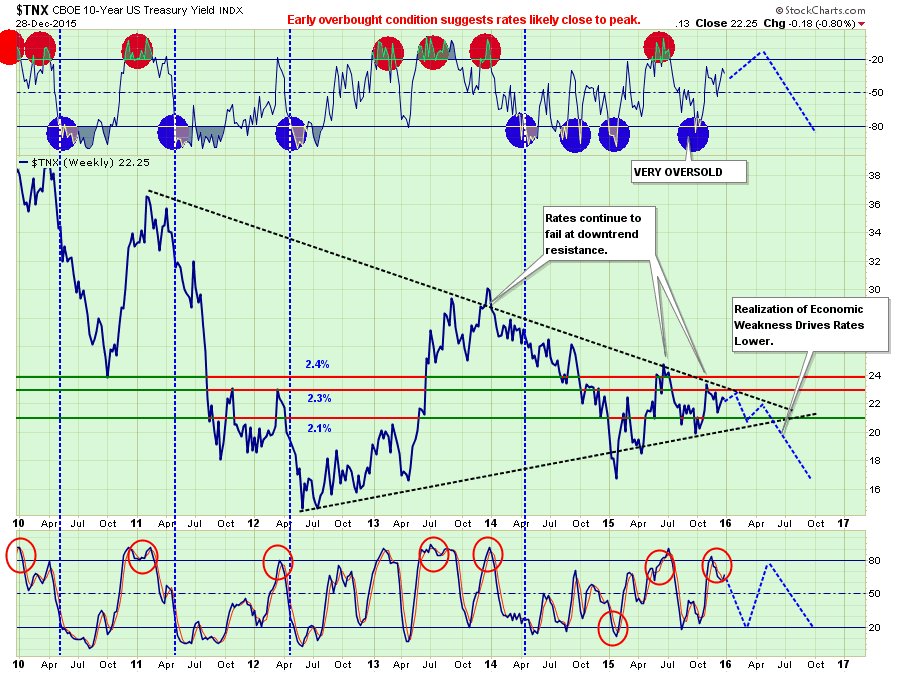
If the Fed does indeed follow their determined path to raise the Fed Funds rate by an additional 1% in the coming year, the result will be a nearly flat yield curve which will remove another “leg of support” from the bulls.
Of course, falling rates means the ongoing “bond bull market” will remain intact for another year. In fact, if my outlook is correct, bonds will likely be one of the best performing asset classes in the next year.
Oil / Energy Remains Weak
Unfortunately, while Energy has already been in a bear market over the last year, it will not improve much in the coming year. Around mid-year, the majority of oil price hedges will have expired and the impact of collapsing oil prices will be reflected in two major areas – energy sector profits and energy related debt.
The historical correlation between the commodity price and energy sector is, not surprisingly, very high.
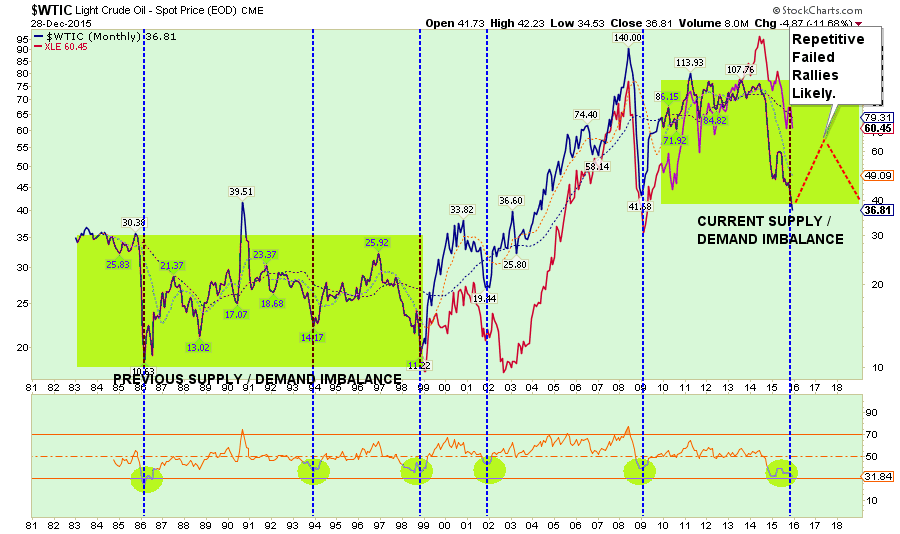
Over the next year, energy prices will likely remain under pressure as the supply of oil continues to outstrip demand.
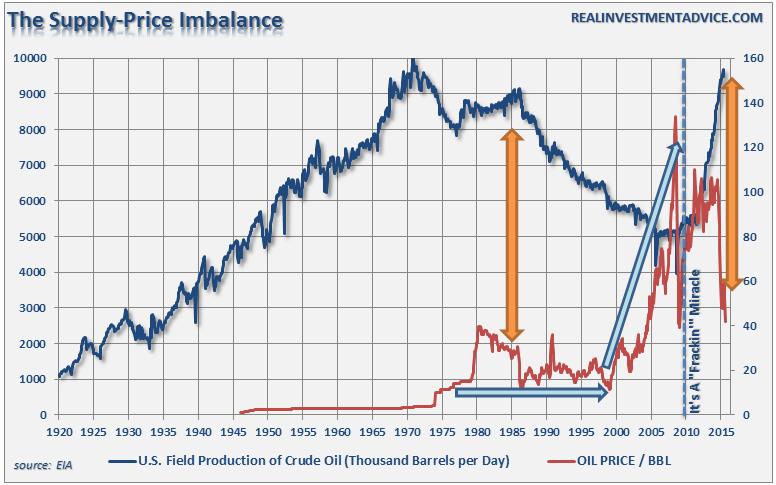
The last time that oil supply was at current levels, oil prices remained mired in a trading range for twenty years. With global growth weak, inflationary pressures low and debt levels at historically high levels, it is unlikely that the resolution of the supply-demand imbalance will be resolved in just a couple of years.
As hedges expire, profits will continue to erode, production will be shut-in, unemployment will rise, CapEx will be cut further and debt-defaults will rise sharply. All of these issues will have broad-reaching economic impacts which will be reflected in weaker rates of economic growth.
NOTE: One of the big issues starting in 2016 will be the reversions of MLP’s. Many investors jumped into MLP’s believing them to be a “no-brainer” investment for income with little or no price risk. As I have suggested many times over the last few years, this was ALWAYS a false premise. In 2016, many companies that spun-off pipelines in the form of MLP’s, will “revert” them back into the parent company as they can buy the asset back very cheaply boosting cash flows of the parent company during a period of weak commodity prices. This will leave MLP investors who just “bought it for the dividend,” receiving back much less than they invested to begin with.
The Long Dollar Trade Ends
One of the most “crowded trades” in the market today is the long-dollar trade. Historically speaking, and from a contrarian viewpoint, any time that a trade has become “crowded” it has been near its end. The strong dollar, which has been the result of a global race to the bottom for other currencies, has negatively impacted economic growth in the U.S. as exports have declined.
From a purely technical perspective, as shown in the chart below, there have only been two times previously when the dollar has been as extended as it is currently. Both times those levels marked the peak of the dollar advance.
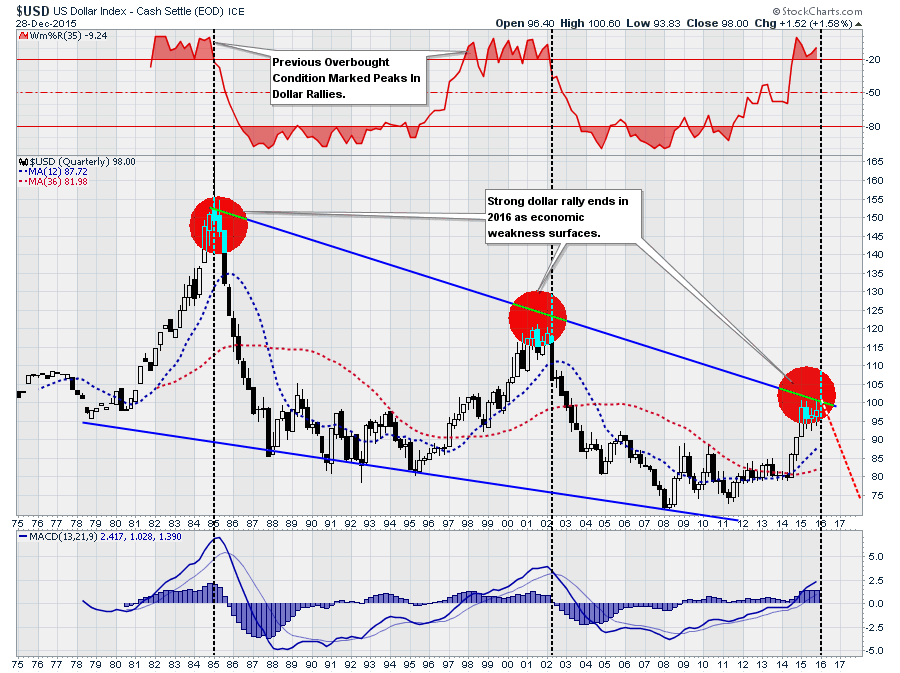
As economic weakness accelerates over the next 12-18 months, due to tighter monetary policies, the dollar will weaken.
Conclusion
The common theme throughout the outlook for 2016 is continued weakness in economic growth. The current economic expansion is one of the longest on record, but has also been at the lowest average rate of growth of any cycle on record. This leaves very little room for any type of policy error.
Statistically speaking, the odds suggest that cash and fixed income are likely to provide some of the highest rates of return in the next year barring a complete reversal in monetary policy by the Federal Reserve.
This is not a “bearish forecast.” It is just an assessment of trends, statistics, and probabilities given the current monetary, financial and economic backdrop.
If I am wrong, and stocks do post modest gains in the coming year, being more conservative will only mean a small relative under performance in your portfolio next year. If I am right, the preservation of capital will be far more beneficial. As I have stated previously, participating in the bull market over the last seven years is only one-half of the job. The other half is keeping those gains during the second half of the full market cycle.
Disclosure: The information contained in this article should not be construed as financial or investment advice on any subject matter. Streettalk Advisors, LLC expressly disclaims all liability in ...
more
Comments
 No Thumbs up yet!

