
Today Looks Nothing Like A Blow-Off Stock Market Top
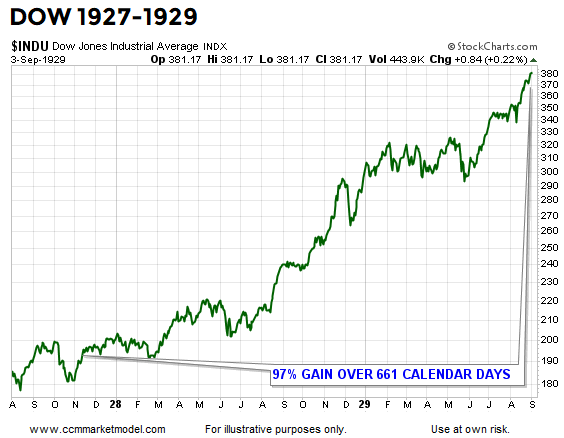
1929: THIS IS WHAT A MELT-UP LOOKS LIKE
Prior to the major stock market peak on September 3, 1929, the Dow Jones Industrial Average gained 97% over the previous 661 calendar days.
(Click on image to enlarge)
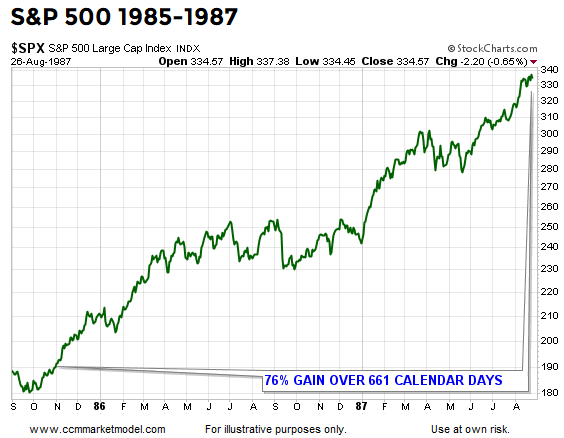
1987: IRRATIONAL EXUBERANCE LOOK
When the stock market peaked in 1987, it was extended in a big way. The gain over the previous 661 calendar days was 76%.
(Click on image to enlarge)
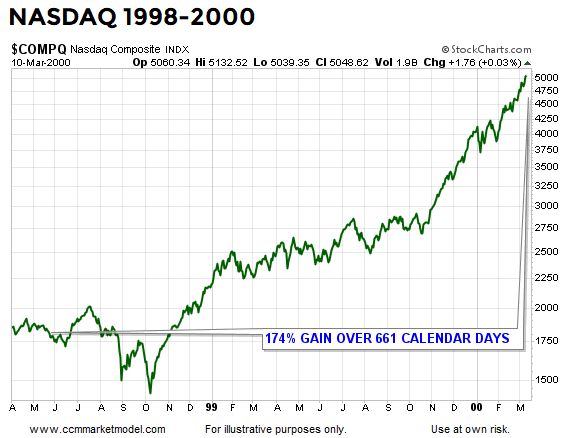
2000: THIS IS WHAT A BLOW-OFF TOP LOOKS LIKE
Blow-off tops are rare, but they do occur from time to time. One of the best examples in history is the final leg up in the NASDAQ before the bubble popped in 2000. It is an understatement to say the market was extended and vulnerable on March 10, 2000. Looking back at 661 calendar days from the peak, the NASDAQ had tacked on an unbelievable 174%.
(Click on image to enlarge)
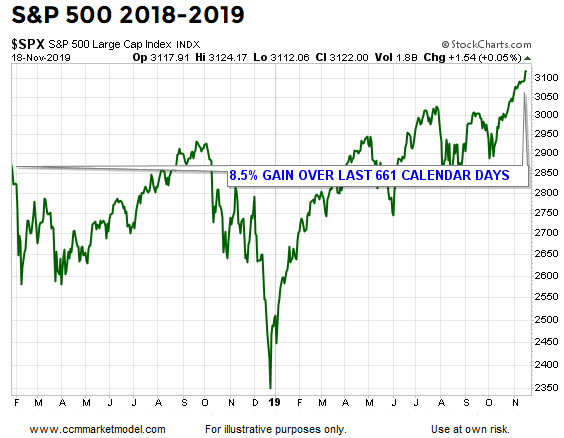
THIS IS WHAT NOVEMBER 2019 LOOKS LIKE
Instead of posting eye-popping gains, like 97%, 76%, or 174%, if we look back over the last 661 calendar days, the S&P 500 has gained a modest 8.5%. Risk speaks to being extended from a base (see three cases above). In 2019, we are just now trying to break out from a long-term base. Relative to history, the terms “melt-up” and “blow-off” do not apply to the facts we have in hand today.
(Click on image to enlarge)
2019 LOOKS LIKE THE EARLY STAGES OF A NEW TREND
This week’s stock market video covers a wide range of bullish and bearish periods from history to test the cyclical-low hypothesis that was formed in January 2019. You can draw your own conclusions after seeing comparisons to 1929, 1974, 1987, 2000, and 2007.
DAY BY DAY ACCORDING TO THE DATA
The charts above help us with the same “keep an open mind about all outcomes” concepts that were captured in the blurb below from a February 20, 2019 post:
“Having something concrete and measurable that differentiates 2018-2019 from three of the greatest percentage-decline bear markets in history (73-74, 00-02, 07-09) speaks favorably to bull/bear probabilities in February 2019.”
The data we have in hand today tells us the market’s upside potential is much greater than many can wrap their minds around. If the data deteriorates in a meaningful way, we must be flexible enough to reassess the odds of good things happening relative to the odds of bad things happening.


