
One Year Inflation Expectations
Expectations and forecasts from economists continue to diverge from consumer-based expectations.
(Click on image to enlarge)
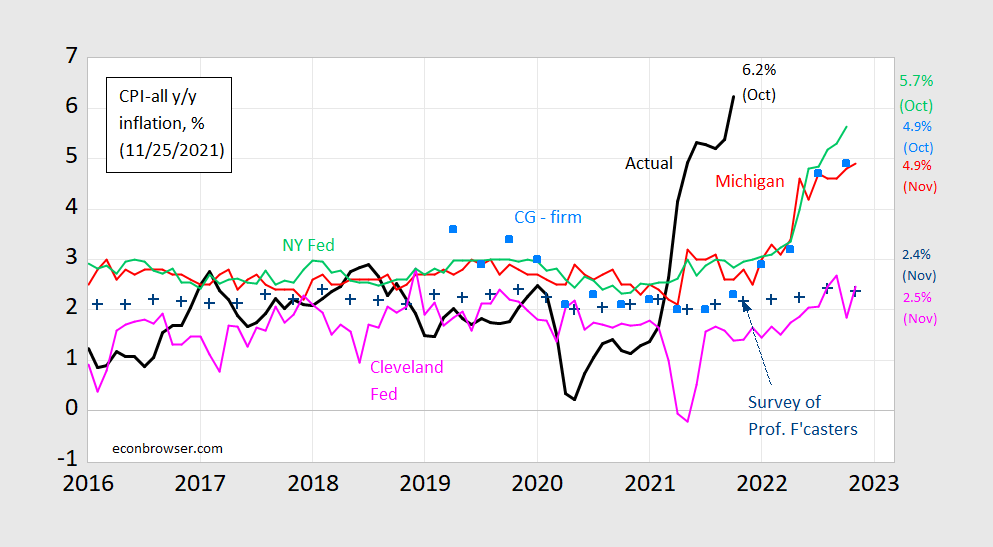
Figure 1: CPI inflation year-on-year (black), median expected from Survey of Professional Forecasters (blue +), median expected (preliminary) from Michigan Survey of Consumers (red), median from NY Fed Survey of Consumer Expectations (light green), forecast from Cleveland Fed (pink), mean from Coibion-Gorodnichenko firm expectations survey [light blue squares]. Source: BLS, University of Michigan via FRED and Investing.com, Reuters, Philadelphia Fed Survey of Professional Forecasters, NY Fed, Cleveland Fed and Coibion and Gorodnichenko.
What forecasts are more unbiased (which is separate from which forecasts more represent agents’ expectations). Over the 1986-2021 period, the following results apply:
πt = 0.022 + 0.128 micht-12 + ut
Adj R2 = 0.00, SER = N = 428, reject unit slope null
πt = 0.022 + 0.542 clevelandt-12 + ut
Adj R2 = 0.166 , SER = 0.012, N = 428, reject unit slope null
πt = 0.004 + 0.788 spft-12 + ut
Adj R2 = 0.259 SER0.011, N = 143, fail to reject unit slope null
All results using HAC robust standard errors.
In other words, the professional economists’ forecasts are more accurate, even when including the recent period.
Disclosure: None.


