By
Kittiampon Somboonsod
of
Trading Lounge
Monday, November 28, 2022 12:05 AM EDT
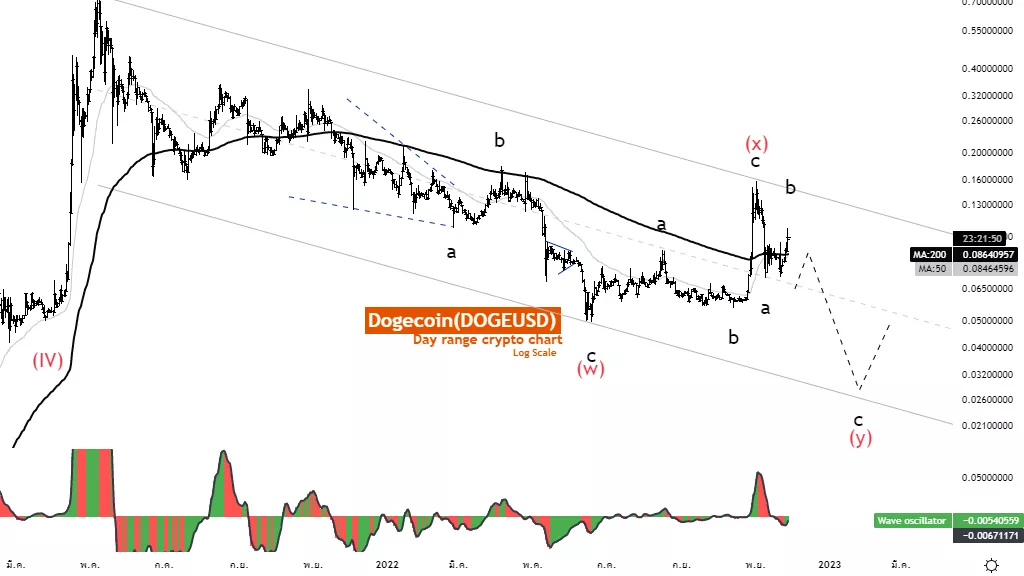
Dogecoin (DOGEUSD)
DOGEUSD Elliott Wave Technical Analysis
Function: Counter trend
Mode: Corrective
Structure: Zigzag
Position: Wave B
Direction Next higher Degrees: wave (Y) of Double Corrective
Details: Wave B retraces in a zigzag pattern at the end, and prices will drop again in wave C.
Wave Cancel invalid Level: 0.1581
Dogecoin (DOGEUSD) Trading Strategy: The structure in the larger image is reduced with a double corrective pattern in the lower (Y) wave, but because the internal sub-wave of the wave is not yet complete. Overall, there is a chance that the rate will continue to decrease.
Dogecoin (DOGEUSD) Technical Indicators: The price is above the MA200 MA50, indicating an uptrend. The Wave oscillator below Zero-Line Momentum is bearish
Elliott Wave Analysis TradingLounge 4H Chart, 28 November 2022
More By This Author:
Elliott Wave Stock Market Summary - SP500, US Stocks
Elliott Wave Technical Analysis: Shopify Inc. - Friday, Nov. 25
Elliott Wave Technical Analysis: Bitcoin - Friday, Nov. 25
Disclosure: As with any trading or investment opportunity there is a risk of making losses especially in day trading or investments that Trading Lounge expresses opinions on. Note: Historical ...
more
Disclosure: As with any trading or investment opportunity there is a risk of making losses especially in day trading or investments that Trading Lounge expresses opinions on. Note: Historical trading results are no guarantee of future returns. Some investments are inherently more risky than others. At worst, you could lose your entire investment and more TradingLounge™ uses a range of technical analysis tools, such as Elliott Wave, software and basic fundamental analysis as well as economic forecasts aimed at minimising the potential for loss. The advice we provide through our TradingLounge™ websites and our TradingLounge™ Membership has been prepared without taking into account your particular objectives, financial situation or needs. Reliance on such advice, information or data is at your own risk. The decision to trade and the method of trading is for you alone to decide, tradinglounge takes no responsibility whatsoever for your trading profits or losses. This information is of a general nature only, so you should, before acting upon any of the information or advice provided by us, consider the appropriateness of the advice in light of your own objectives, financial situation or needs. Therefore, you should consult your financial advisor or accountant to determine whether trading in Indices Stocks shares Forex CFDs Options Spread Betting derivatives of any kind / products is appropriate for you in light of your financial trading circumstances.
less
How did you like this article? Let us know so we can better customize your reading experience.


