
Crude Oil Prices Exit Triangle To The Downside - Implications For USD/CAD
So much for the US-China trade war détente. Just hours ahead of remarks due in from Federal Reserve Chair Jerome Powell at the Jackson Hole Economic Policy Symposium, Chinese policymakers decided to shock markets with two rounds of tariffs on imported US goods.
The tariffs will range from 5% to 10% on $75 billion of imported US goods, divvied up into two tranches on September 1 and December 15 – no coincidence considering that these are the dates that the US has considered implementing 10% tariffs on $300 billion of imported Chinese goods.
As a result of the surprising Chinese tariff news, global growth concerns are back in the picture. To no surprise, crude oil is bearing the brunt of the news. There are implications for the commodity currencies, particularly the Canadian Dollar.
Crude Oil Technical Analysis: Daily Price Chart (August 2018 to August 2019) (Chart 1)
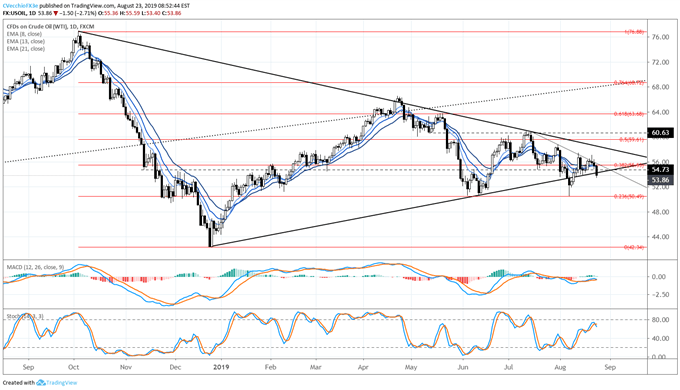
Crude oil prices are starting to breakdown out of a multi-month symmetrical. The false breakout crude oil prices experienced two weeks ago, around the trendline from the December 2018 and June 2019 lows, initially found support around the June 2019 swing lows and the 23.6% retracement of the 2018 high/low range near 50.49.
Now that the attempt to get back into the symmetrical triangle is proving to be a failure – the rebound in crude oil prices was rejected by the trendline from the July and August swing highs – more downside may arrive quickly. Price is trending lower below the daily 8-, 13-, and 21-EMA envelope while both daily MACD and Slow Stochastics have turned lower again. A return towards the June and August swing lows near 50.49 can’t be ruled out in the near-term.
Crude Oil Technical Analysis: Weekly Price Chart (January 2016 to August 2019) (Chart 2)
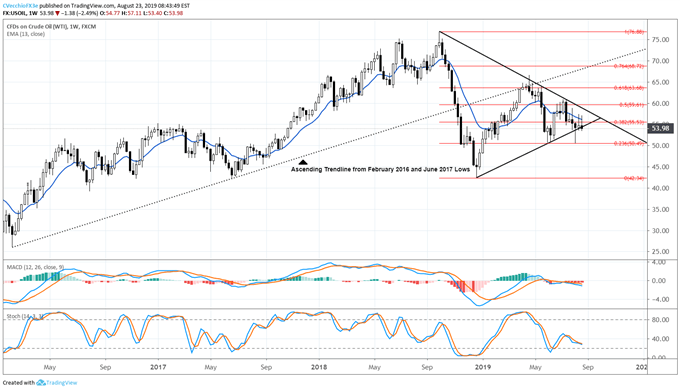
Longer-term, the crude oil price weekly chart continues to suggests that bearish potential persists for a more significant breakdown over the next few weeks. It appears that, for the second consecutive week, we’ll see an inverted hammer on the weekly candle after rejection at the weekly 13-EMA (one quarter moving average).
With daily MACD and Slow Stochastics pointing lower in bearish territory, momentum remains to the downside. It still holds that failure in the symmetrical triangle points to an ultimate return to the December 2018 low at 42.34.
IG Client Sentiment Index: Crude Oil Price Forecast (August 23, 2019) (Chart 3)
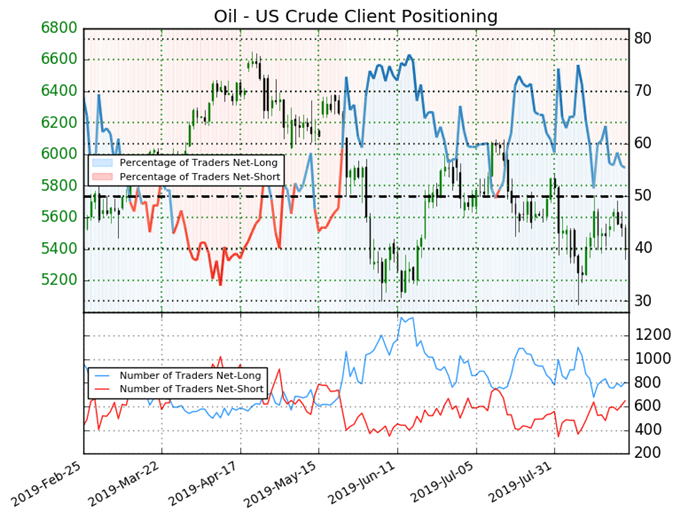
Crude oil prices: Retail trader data shows 55.4% of traders are net-long with the ratio of traders long to short at 1.24 to 1. In fact, traders have remained net-long since August 13 when crude oil prices traded near 54.89; price has moved 1.7% lower since then. The number of traders net-long is 1.2% lower than yesterday and 3.8% lower from last week, while the number of traders net-short is 7.3% higher than yesterday and 15.1% higher from last week.
We typically take a contrarian view to crowd sentiment, and the fact traders are net-long suggests crude oil prices may continue to fall. Yet traders are less net-long than yesterday and compared with last week. Recent changes in sentiment warn that the current crude oil prices trend may soon reverse higher despite the fact traders remain net-long.
Recent Price Action Runs Counter to Longstanding Relationships
A rough proxy for this is the relationship between USDCAD and crude oil prices in recent day. In our last crude oil technical update on August 16, the 5-day correlation between USDCAD and crude oil prices was -0.60 and the 50-day correlation was -0.77; today, the 5-day correlation is -0.05 and the 50-day correlation is -0.71. The Canadian Dollar has been able to withstand pressure thus far that an otherwise weaker oil price environment would be expected to bring about.
USD/CAD Technical Analysis: Daily Price Chart (September 2018 to August 2019) (Chart 4)
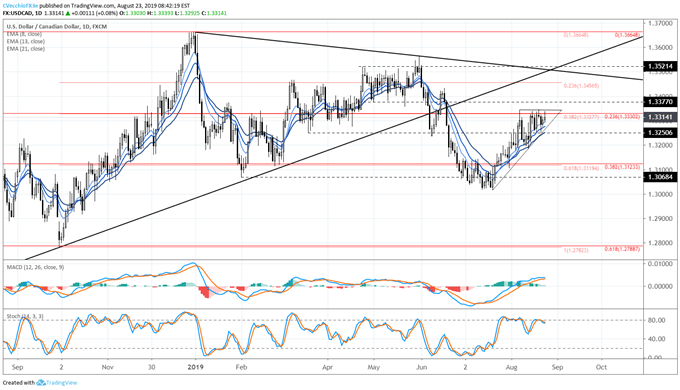
USDCAD prices continue to coil in a symmetrical triangle, as they have over the course of the month of August. Despite a breakdown in short-term correlations, the path of least resistance for USD/CAD remains higher if crude oil prices are going to struggle further. Price continues to linger below resistance near the 23.6% retracement from the September to December 2018 high/low range as well as the 38.2% retracement of the 2018 high/low range around 1.3225/30.
With USD/CAD continuing to trade above the daily 8-, 13-, and 21-EMA envelope, daily MACD continuing to rise in bullish territory and Slow Stochastics holding near overbought territory, the path of least resistance remains to the topside.
IG Client Sentiment Index: USD/CAD Price Forecast (August 23, 2019) (Chart 5)

USDCAD: Retail trader data shows 37.8% of traders are net-long with the ratio of traders short to long at 1.65 to 1. In fact, traders have remained net-short since July 23 when USDCAD traded near 1.30537; price has moved 2.0% higher since then. The number of traders net-long is 2.6% lower than yesterday and 22.3% higher from last week, while the number of traders net-short is 5.9% higher than yesterday and 4.1% lower from last week.
We typically take a contrarian view to crowd sentiment, and the fact traders are net-short suggests USDCAD prices may continue to rise. Traders are further net-short than yesterday and last week, and the combination of current sentiment and recent changes gives us a stronger USDCAD-bullish contrarian trading bias.


